Drowning in Data: A Data Science Primer for a Translational Scientist
In 1945 the volume of human knowledge doubled every 25 years. Now, that number is 12 hours [1]. With our collective computational power rapidly increasing, vast amounts of data and our ability to assimilate it, has seeded unprecedented fertile ground for innovation. Healthtech companies are rapidly sprouting from data ridden soil at exponential rates. Cell free DNA companies, once a rarity, are becoming ubiquitous. The genomics landscape, once dominated by the few, are being inundated by a slew of competitors. Grandiose claims of being able to diagnose 50 different cancers from a single blood sample, or use AI to best dermatologists, radiologists, pathologists, etc., are being made at alarming rates. Accordingly, it’s imperative to know how to assess these claims as fact or fiction, particularly when such claimants may employ “statistical misdirection”. In this addition to “The Insider’s Guide to Translational Medicine” we disarm perpetrators of statistical warfare of their greatest weapons, statistics themselves. To do so we introduce a novel BASIS acronym for analyzing data underlying AI models and new products. Moreover, we introduce a unique harm / inherency / plan / solvency / disadvantage paradigm for developing and assessing business plans, grants, healthtech, genomics companies, etc. We provide a use case for implementation of these thought constructs to assess new entrants in the melanoma detection. Ultimately, I intend to leave you with a rigorous approach to discriminate the good from the bad, and everything in between, in healthtech, multiomics, etc.

Image credit: Adrienn Harto
Putting You to Work
You are an investor and CEO of Biopharmatrend.com Investment Group, BPTIG, and are considering four companies in early melanoma detection to invest in: DermTech, Melanoma AI, Skin Analytics, and Cancer Canines.
DermTech (DMTK), a company listed on the NASDAQ stock exchange, talks to you about a disruptive technology they developed called the "Smart Sticker" (figure 1).

Figure 1: DermTech’s melanoma detection Smart Sticker.
They claim that, rather than have to biopsy a patient's skin to determine if a mole is melanoma or not, a physician can simply place the Smart Sticker on the patient's skin [2]. The sticker entails a proprietary technology allowing for the capture of skin cells and subsequent processing at DermTech’s central facility (figure 2). The mole is identified as malignant or not by their Pigmented Lesion Assay (PLA) that tests corresponding cells for expression of two genes, long intergenic nonprotein coding RNA 518 (LIC00518), and preferentially expressed antigen in melanoma (PRAME). DermTech is very quick to inform you they have a National Comprehensive Cancer Network (NCCN) guidelines category 2B designation [3], and a >99% negative predictive value, 91% sensitivity, 69% specificity, and AUC of 0.9 for melanoma detection [4].
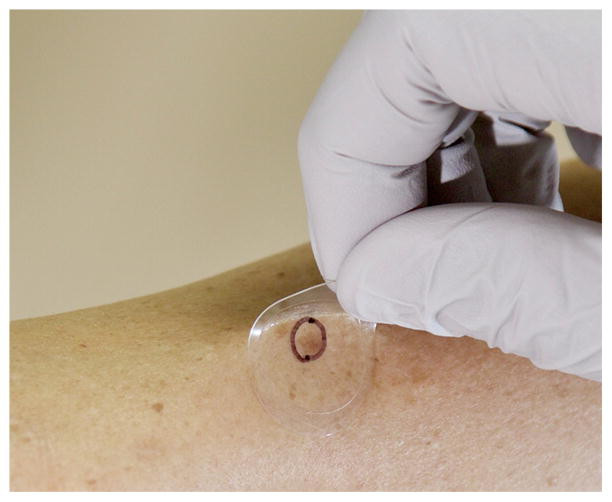
Figure 2: Skin cells being obtained using the Smart Sticker. The lesion of interest is marked with a circle and only the corresponding skin cells are tested.
They emphasize their test is non-invasive and will not leave a patient scarred; in contrast to shave, punch, and excisional biopsies, the predominant techniques dermatologists use to sample moles. As of May 27, 2022, DermTech had a stock price of 7.14 with a market cap of 214 million dollars [5]. You are considering making a sizeable stock purchase, particularly as DermTech’s stock price was inexplicably as high as 79.76 on February 19, 2021 (figure 3).
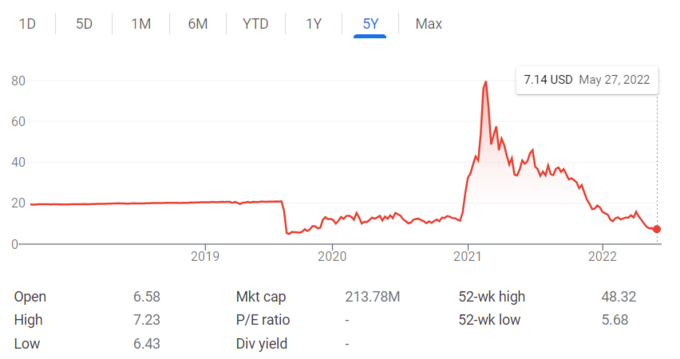
Figure 3: DermTech (DMTK) stock price.
Melanoma AI is an MIT outfit that contends they built a deep convoluted neural network (DCNN) that allows patients to detect if they have melanoma through wide-field imaging of their skin at home or their primary care physician’s office (figure 4). The model is predicated largely on the “ugly duckling” concept that preferentially identifies skin lesions that look very different than others on the patient’s body [6].
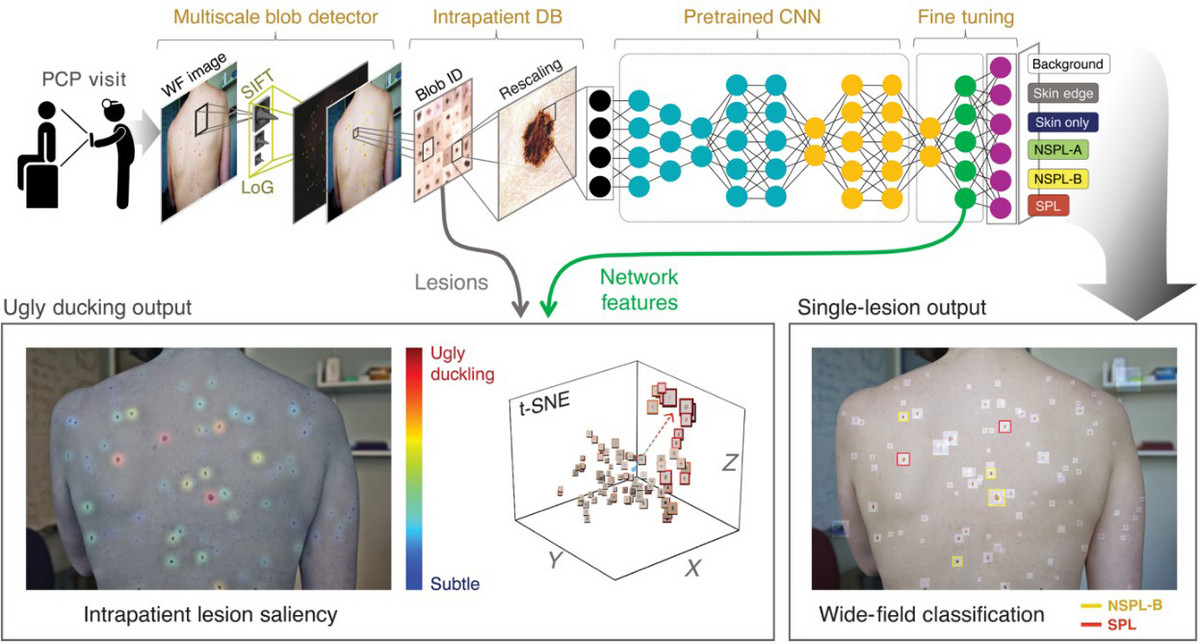
Figure 4: Wide-field DCNN in classification of suspected pigmented lesions (SPL in red) from others. Wide image pictures are taken of a patient’s skin at their primary care physician’s office and analyzed via a DCNN (top panel). Ugly duckling lesion analysis is performed and suspicious lesions are identified (bottom panel).
They reference a paper published in Science Translational Medicine February, 27, 2021, where they had a sensitivity of 90.3%, specificity of 89.9%, accuracy of 86.56%, and AUC of 0.97 for differentiating “suspicious pigmented lesions (SPLs)” from others. They site numerous articles in various journals celebrating their DCNN algorithm. They are a private company currently looking for series A funding, and are asking for 10 million dollars at a 100-million-dollar valuation.
Skin Analytics, like Melanoma AI, believes they have the best AI based neural network that allows people to use their cell phones with dermascopes to determine if moles are melanoma or not (figure 5). They cite a paper they published in Dermatology, October 16, 2019, and state the UK NHS presently uses their AI technology, Deep Ensemble for the Recognition of Malignancy (DERM), for melanoma detection [7]. They report an AUC of 0.901, 99% negative predictive value, 100% sensitivity, and 64.8% specificity for determining if a lesion is melanoma or not using images obtained from an iPhone 6s attached to a dermascope. They reveal a series A funding round of 9 million dollars with 16 investors involved. They are presently asking for 10 million dollars at a 100-million-dollar valuation in Series B funding.
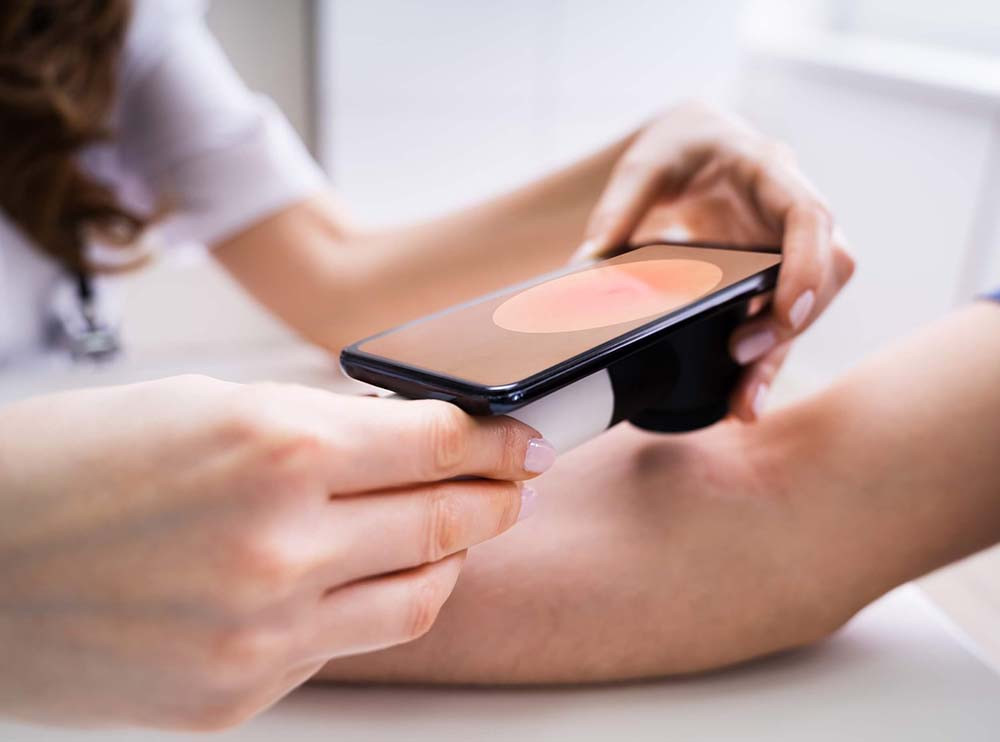
Figure 5: Cell phone with dermascope examination of a nevus using Skin Analytics DERM.
Cancer Canines trains dogs to use their extraordinary olfactory sense to determine if moles are malignant or not (figure 6). They contend that melanomas emit volatile organic compounds (VOCs), small odorant molecules that evaporate at normal temperatures and pressures, and that dogs have the keen olfactory senses required to detect them (9-10).
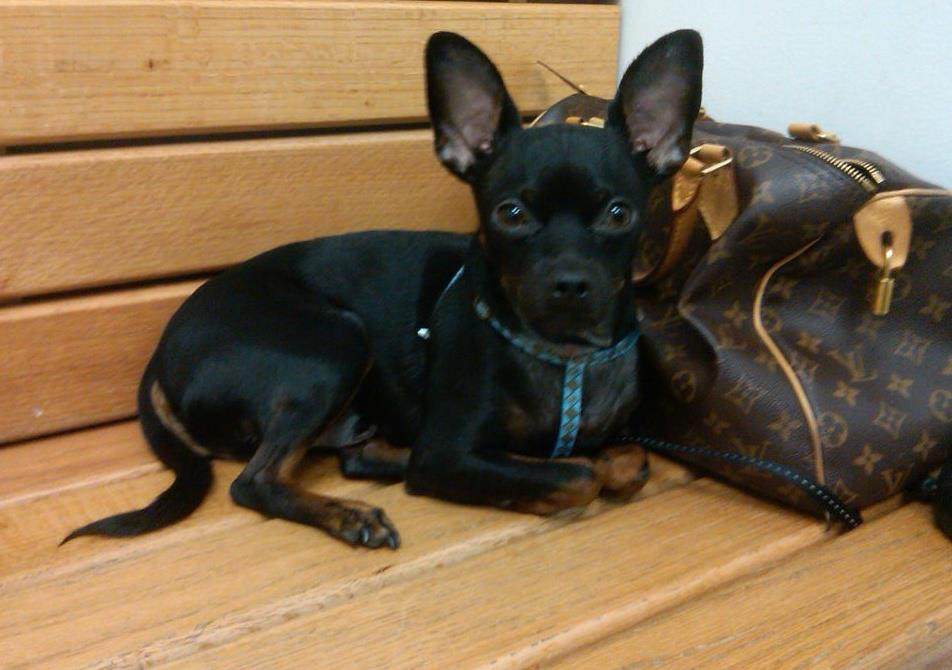
Figure 6: Cancer Canines secret weapon, Bolt, who is actually one of my rescue dogs.
During their pitch to you, they report a case of a 43-year-old female who presented with a mole on her central back that was present since childhood and changed over the last few years (figure 7).
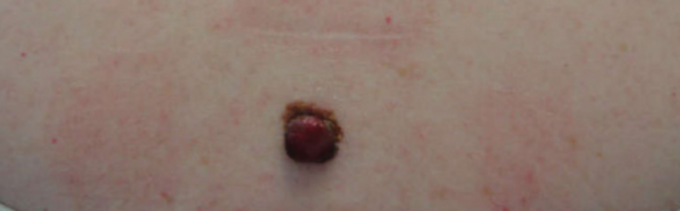
Figure 7: A 43 year old female with a suspicious mole.
Her 2-year-old rescue dog frequently sniffed the mole and would get agitated and try to scratch and bite it. This prompted the woman to go to the dermatologist, who determined the mole was a stage 3B malignant melanoma (figure 8).
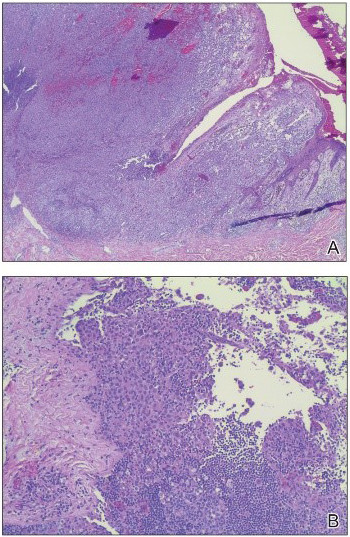
Figure 8: Biopsy revealed malignant melanoma.
After surgical removal of the lesion the woman reported her dog no longer became agitated when it sniffed her back. She is still alive 7 years later. Based on this, Cancer Canines conducted studies demonstrating dogs they trained to detect melanoma correctly identified melanomas 45% of the time. They propose placing cancer canines in kiosks in cities throughout the world to help facilitate early detection of melanoma. They are asking for 3 million dollars at a 10-million-dollar valuation.
Lies, damn lies, and statistics
You, as the CEO of BPTIG, are very impressed. The numbers being thrown around are stupendous and you firmly believe you've stumbled on disruptive technology that might replace dermatologists to some extent. Indeed, you are astutely aware numerous studies showed AI performed better than dermatologists at diagnosing skin maladies. Moreover, there is a profound shortage of dermatologists in the U.S.A [12]. You have been told this is due to the American Dermatology Association ensuring the number of available residency spots doesn't increase significantly. In addition, you noticed many dermatologists appear to be running cosmetic shops that focus on administering botox, restalyn, collagen, laser treatments, etc., rather than caring for melanoma.
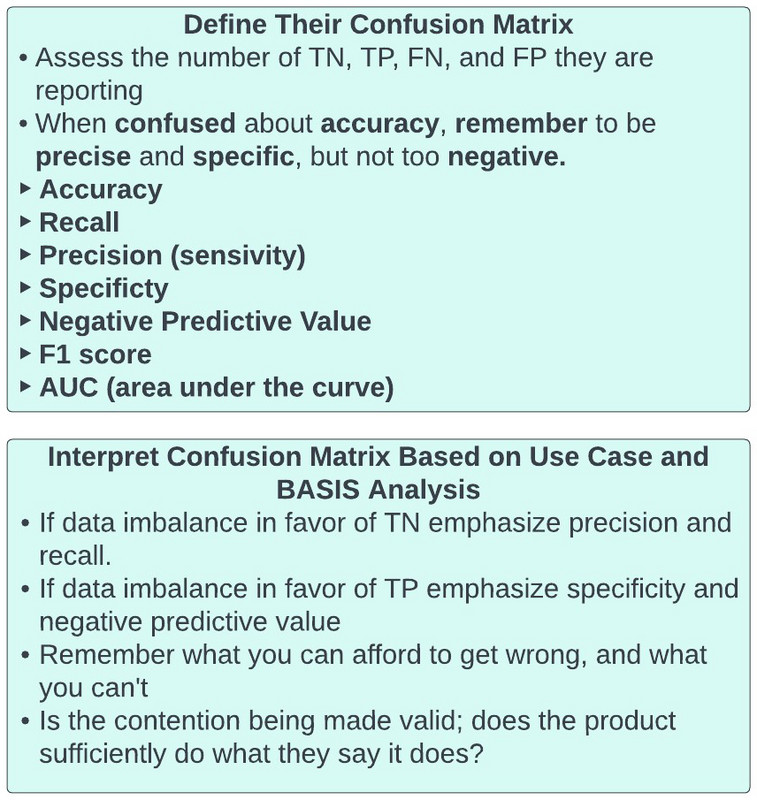
After daydreaming about being a dermatologist you realize you digressed a bit. You snap back to reality and reassess your excitement about the four proposals before you. Specifically, you recall reading an editorial written by Basem Goueli MD, PhD, MBA, where he insisted that “when you're confused about accuracy, remember to be precise and specific, while not being too negative.” You look on biopharmatrend.com to revisit what he wrote and see:
In the world of fast money many disciplines are prone to hyperbole. Pharmaceutical companies boast of phase 1 data that barely provides an incremental improvement over the status quo. They celebrate "me too" drugs that even politicians are beginning to speak out against [12]. Physicians tout "best doctor" awards they've "won" that have little to do with ability or talent, and are either glorified popularity contests or outright paid for by the physician [13]; I have had three offers this year to buy a top doctor award (figure 9).

Figure 9: Modern Healthcare exposes Top Doctor Awards.
The American Board of Internal Medicine (ABIM) claims they are the authority on ensuring physicians are current in their field, but many questions they ask on their certification examinations are incredibly esoteric and largely clinically irrelevant, and physicians can actually use uptodate.com DURING their tests to look for answers.
For every Jeff Bezos or Bill Gates, there is an Elizabeth Theranos or Bernie Madoff trying to grift you out of your money with big promises and flowery rhetoric. Every day we see announcements of companies getting tens of millions of dollars in investor money and we struggle to understand why. Indeed, I recently saw a company that got 29 million dollars in series C funding and their platform DOESN’T PRESENTLY WORK.
Investors from 2020-2022 seem to have been particularly prone to smoke and mirrors emanating from heathtech companies. Unsurprisingly, many individuals flocked to the sector to try and profit off unsuspecting, but well-meaning investors, who truly want to help society while making money at the same time (figure 10).

Figure 10: Well-meaning investors need to be on Healthtech fraud alert at all times.
I composed this article to assist all of the well-meaning individuals in this world, whether it be investors, health care companies, pharmaceuticals, etc., as they seek to help patients, and/or are bombarded by claims of superiority and disruption. The arsenal of choice for the claimants is often statistics, and we will do what we can to disarm the perpetrators of their greatest weapons.
Setting The Scene
It has been mesmerizing to see the explosion in data science over the last decade. A simple tour on LinkedIn, Upwork, Fivrr, etc. suggests nearly everyone on the planet is a data scientist. Accordingly, as you can't put the toothpaste back in the tube, the data science revolution is here to stay. Allow me to state for the record, this is a tremendous development and will propel society forward. I’m a firm believer everyone should develop some familiarity with data science (see supplemental information for my favorite way to do this). At the very least everyone needs to be facile with very important statistical concepts.
Suppose for a moment I tell you that my superpower is I can predict if a mole is melanoma or not with 93% accuracy, 100% negative predictive value (NPV, not to be mistaken with net present value), a 7% misclassification rate, and 100% specificity. I also tell you I’ve already convinced STARK industries to give me 2 million dollars at a 10-million-dollar valuation based on these claims. You seem suspect, but are interested in seeing me in action.
Having done your homework you know that only 1 in 10,000 moles become melanoma, and only approximately 7% of “suspicious pigmented lesions (SPLs)” that are biopsied are malignant melanoma. You manage to acquire 100 pictures of SPLs, labeled as melanoma or benign based on associated biopsies.
You invite me to your mansion in Medina, Washington (figure 11), to observe me in action. I arrive by boat in one of my patented three-piece suits with an ayre of unprecedented self-confidence (figure 12).

Figure 11: Your mansion in Medina, Washington [14].
I wave to you with mixed indifference, as though I’ve seen houses like your countless times before, and Tony Stark just gave me 2 million dollars in investment. Hiding behind my sunglasses, I am admittedly in bewildered awe of what I’m seeing, and think to myself, “I could fit a lot of homeless people and orphans in this house.”

Figure 12: Model reenactment of the suit I arrive in at your mansion [15].
After walking uphill to get to the entry door I stroll into the foyer. I’m immediately struck by how technologically advanced the facility is and wonder why everything says Microsoft. Ultimately, I arrive in an amphitheater like room and sit in the most comfortable movie chair I’ve ever seen (figure 13).

Figure 13: The amphitheater in your mansion where you try to expose me as a fraud [16].
Nearly falling asleep the minute after I recline in the chair; you remind me why I’m there. You immediately turn off the lights in the room and begin projecting images from the patient data set you acquired.
In line with the observation that approximately 7% of suspected pigmented lesions biopsied are melanoma [17], the data set contains pictures of 93 benign lesions and 7 melanoma. As the first image is projected on the screen I ask if we can eat dinner prior to my predictions. You say, “no”.
With the first image on the screen, I stand up from the chair and begin assessing the movie sized picture. I apply the ABCDE (asymmetry, border, color, diameter, evolution) logic for evaluating moles taught to me in medical school, while staring intensely at the picture (figure 14). After five minutes I tell you the mole is benign.
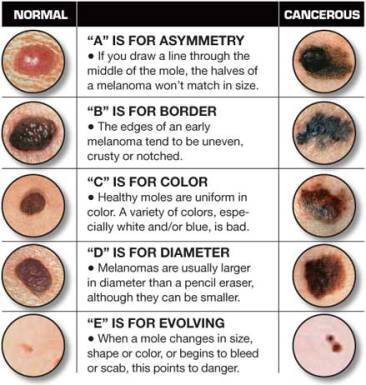
Figure 14: The ABCDEs of melanoma [18].
Knowing the answers, you note that I am correct in my assessment. However, you’re aware the data set is markedly imbalanced with only 7% of the images being melanoma. Blind luck could have allowed me to guess the first SPL.
You quickly project the second SPL picture on the screen. Again, you watch as I put my hands on my face and stare intensely at the picture. You then see me walk around feigning use of my superpower. After five minutes I tell you SPL #2 is negative. Again, you note I’m correct.
With a list showing the order the SPL pictures will be presented, and whether they are malignant or not, you note the first melanoma picture is #9.
About an hour passes between picture #1 and #8. You can hear my stomach grumbling, but refuse to let me eat. You have watched me do my “melanoma dance” repeatedly, only to say after five minutes that every picture was not melanoma. So far, I’m 8 for 8.
You start to feel excitement when picture 9 appears. Indeed, you have been readily anticipating this moment. You study me carefully as I walk around supremely confident in my ability. Ultimately, after completing the routine you’ve witnessed 8 times before, I tell you the SPL on the screen is benign.
“Eureka!”, now you have me. You knew something was amiss, and you must be right. Yet, being a very intelligent person, you acknowledge I guessed 8 of 9 SPLs correctly, and whatever system I’m using could have merit. You are unprepared to label me a grifter until you’ve seen more. You glance at your sheet with the labeled SPLs and are frustrated the next SPL isn’t until picture 27. You calculate in your head that to get through the next 91 images at 5 minutes each will take over 7.5 hours (455 minutes).
You reassess how it is I got the appointment with you, given how busy you are. You recall it was a friend of yours that knew me that asked you to meet with me, and you obliged them. You are painfully regretting that decision at this moment. Yet, you haven’t proven I’m a fraud yet.
With your stomach screaming at you and the audible bowel sounds emanating from me you decide it’s time for dinner. You watch me savor every bite of the filet mignon in front of me. You note that I’ve taken every liberty offered, including a second helping of the entrée, and you know I’m going to ask for seconds on desert. Yet, you’re too far invested in the night to not play out the string.
After watching me clearly stretch out dinner for 2 hours you welcome me back to the amphitheater. I ask to use the restroom, where I spend another 15 minutes, before returning to the amphitheater. You’re curious what I was doing, but dare not ask.
SPL #10 projects on the screen and I’m right back at doing my “melanoma dance”. You look at your watch and note that it’s already 8 PM, and resign yourself to the fact you will be there until 3:30 AM before being able to definitively call me a fake.
Hours later SPL #27 projects on the screen. By this point you feel you’ve seen more SPLs to last a lifetime. You’re starting to believe you might even be able to tell the difference, that is until you see SPL #27 that looks very similar to many others that were benign. You are very careful not to change any mannerisms while watching my SPL #27 melanoma dance, as you don’t want to give anything away.
“Benign”, you hear me say, and you smirk every so slightly. As we agreed before we started you are not to reveal if my predictions are correct or not. I try to read your eyes, but you, like Lady Gaga, have a very good poker face. You note that I’ve been correct 25 of 27 times, but the 2 times I was wrong the SPLs were melanoma.
You’ve never quit anything in your life, and even though we’re nearing your bed time, you are committed to seeing “the grift” play out. The next melanoma is image 43.
SPL #43 appears and you hear me say, “benign” again. At this point you think you’re truly on to me because 43 SPLs have been shown and I guessed they were all benign. Although I’ve been right 40 times, I’ve been wrong the only three times it truly mattered.
The clock now reads 3:30 AM and you are barely conscious (figure 15).

Figure 15: A baby reenacting you at 3:30 AM during our meeting [19].
You’re astounded as you look at me because I am wide awake (figure 16). You remember me telling you I work over 100 hours a week and almost never sleep. You thought it was hyperbole, but now you’re starting to believe me.

Figure 16: A child reenacting me at 3:30 AM during our meeting [20].
SPL #100 appears on the screen and in a barely audible voice you ask me if I think it’s malignant or benign. I tell you it’s malignant. “Wait, what did you say?”, you ask me as it’s the first time I said the lesion was malignant. I tell you I said it was malignant, but I was just trying to jolt you awake. I then confirm I feel the lesion is benign.
You were already annoyed, but now you’re irate. You wasted a day on my charade to appease your friend, and are infuriated thinking I might be having fun at your expense. You are thankful we’re nearly done as you assess the final tally. Of the 100 SPLs shown, like I said I would be, I was 93% accurate in my designation of them as malignant or benign. My negative predictive value and specificity was 100%, and my misclassification rate was only 7%. And then, as you rush me down the stairs and on the boat at the dock where I arrived, it dawns on you the game I was playing all along.
The Lamppost
Benjamin Disreali once wrote, "There are three types of lies — lies, damn lies, and statistics". Ron DeLagge II penned, “99 percent of all statistics only tell 49 percent of the story.” Finally, Andrew Lang stated, “Most people use statistics like a drunk man uses a lamppost; more for support than illumination”.
The morning after our interaction at your house you reflect on the initial conversation we had. You realize that I very carefully spoke of accuracy, negative predictive value, misclassification rate, and specificity, but you don’t remember me mentioning precision, recall, error rate, F1 score, or area under the curve (AUC). I used the lamppost as support, but not for illumination. And with that, you realize you can hate the player, but you have to respect the game. You break it down as follows.
Initially, when developing prediction models, such as whether a SPL is melanoma or not, or what a stock price will be tomorrow, one can use regression or classification. Regression is chosen when the output variable is continuous, such as stock price, age, salary, height, etc. Classification is used when the output variable is categorical, such as melanoma versus benign, winning versus losing, etc. Accordingly, my melanoma detection superpower is a classification model.
When evaluating the efficacy of classification models, we generate a confusion matrix that relates actual values to predicted values. In our aforementioned melanoma dance (figure 17):
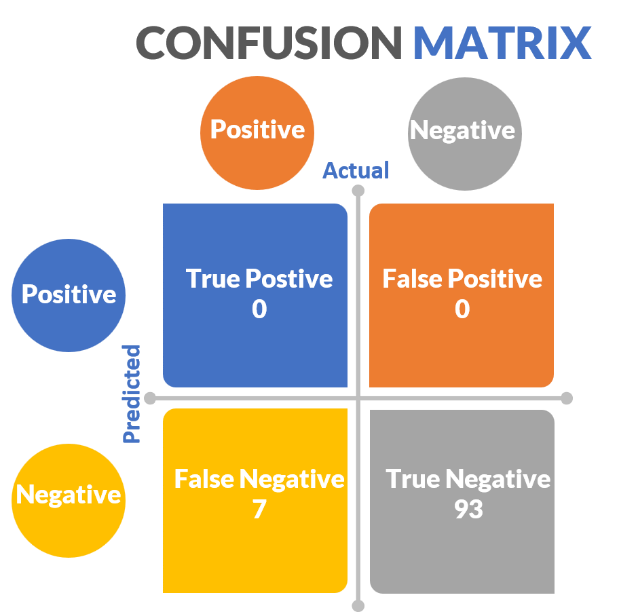
Figure 17: Confusion matrix for the experiment testing my melanoma detection superpower.
- True positives (predicted positive same as actual positive) = SPLs that are melanoma that I stated were melanoma = 0
- False positives (predicted positive different than actual negative) = SPLs that I said were melanoma that were not = 0
- True negatives (predicted negative same as actual negative) = SPLs that I correctly said were not melanoma = 93
- False negatives (predicted negative different than actual positive) = SPLs that I incorrectly said were not melanoma that actually were = 7
With the confusion matrix in hand, we can now obtain important metrics of model efficacy, illustrated in figure 18.
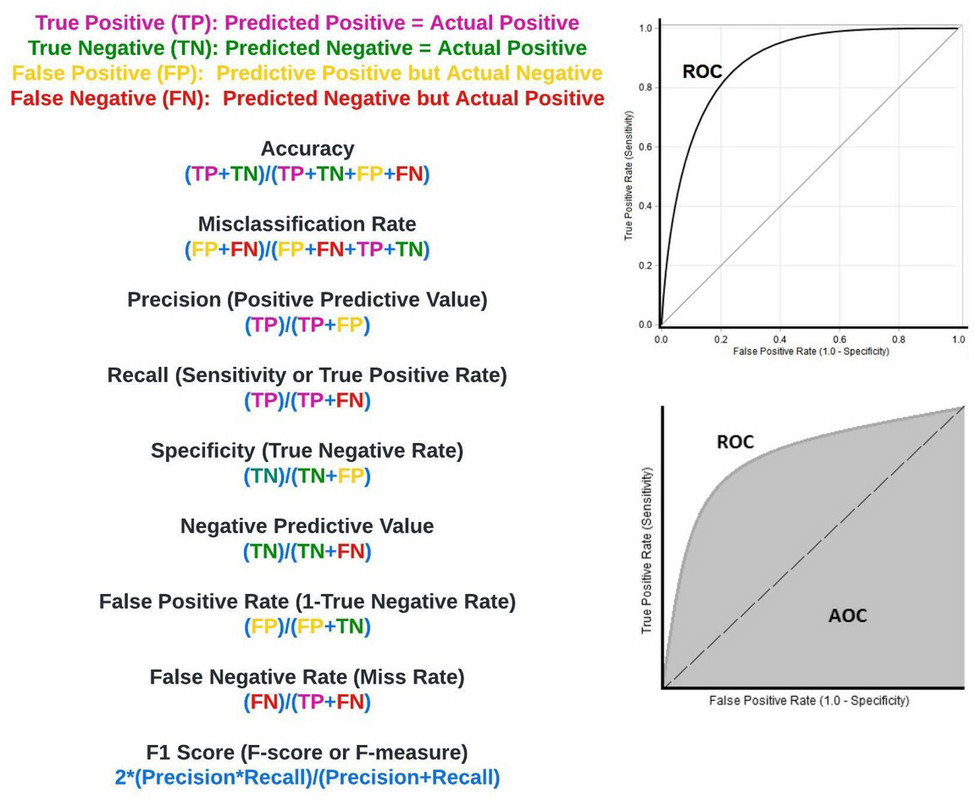
Figure 18: Confusion matrix measures of critical importance.
Accuracy: Refers to the overall percentage of times our predictions matched actual outcomes. It is calculated as above, with my superpower being 93% accurate (figure 19).
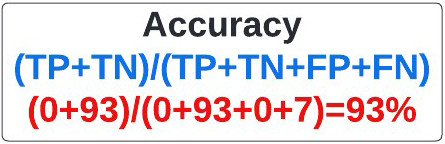
Figure 19: Equation for accuracy.
Misclassification Rate: Sometimes referred to as the error rate, the misclassification rate refers to the overall percentage of times our predictions didn’t match actual outcomes. It is calculated as above (figure 20), with my superpower having a 7% misclassification rate.
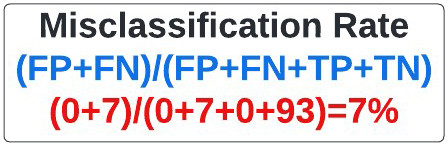
Figure 20: Equation for Misclassification Rate.
Precision: Commonly referred to as the positive predictive value, precision refers to the percentage of times a predicted positive in our model was a true positive. It is calculated as above (figure 21). In our extreme example where no positive (melanoma) predictions were made, the precision is undefined because the true positive and false positive rate are zero.

Figure 21: Equation for Positive Predictive Value.
Recall: Frequently called the sensitivity, and more rarely the true positive rate, recall refers to how often we detect the event of interest when it is actually present (e.g. properly identifying patients with a rare disease in a large sample population). In our case, sensitivity refers to how often we identified a mole as melanoma when it was. It is calculated as above (figure 22), and is essentially the melanomas (positives) identified by the model divided by all the melanomas present. In our extreme case the recall, also known as sensitivity, was 0% as I failed to identify any of the seven melanomas in your sample set.

Figure 22: Equation for Recall.
Specificity: Sometimes referred to as the true negative rate, specificity refers to how often we identify something as negative that is actually negative. In this case it refers to how often we conclude an SPL wasn’t melanoma when it wasn’t melanoma. My superpower had 100% specificity based on our calculations, largely because I said every mole was negative (figure 23).

Figure 23: Equation for Specificity.
Negative Predictive Value: Often used in statistical subterfuge, the negative predictive value refers to how often something was negative when we said it was negative. My superpower, based on our calculations, had a negative predictive value of 93% (figure 24).
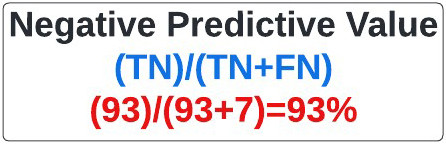
Figure 24: Equation for Negative Predictive Value.
False Positive Rate: Very useful in determining the ROC and AUC (see below), the false positive rate refers to the rate at which we falsely predicted something would be positive when it was actually negative; how often I said a mole was melanoma when it wasn’t. It is calculated as above, and can also be determined by subtracting specificity from 1. In our extreme example, the melanoma superpower has a false-positive rate of 0%, due to my saying none of the SPLs were melanoma (figure 25).

Figure 25: Equation for False Positive Rate.
False Negative Rate: Basically, the opposite of the false positive rate is the false negative rate, otherwise known as the miss rate. It refers to the rate at which we falsely predicted something would be negative relative to when it was actually positive. It is calculated as above. In our extreme example, the melanoma superpower has a miss rate (false negative rate) of 100%, as I was wrong with all 7 melanomas (figure 26).

Figure 26: Equation for False Negative Rate.
F1 Score: Otherwise known as the F-score or F-measure, the F1 score is an oft used statistical measure that encompasses precision and recall. Ranging from 0 (worst) to 1 (best), you may hear a model’s efficacy described by its F1 score. In our extreme example, the F1 score is undefined because no positive predictions (melanoma) were made (figure 27).
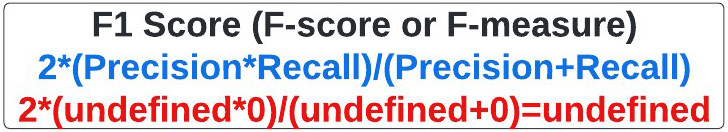
Figure 27: Equation for F1 Score.
Receiver Operating Curve (ROC) curve: The ROC curve is used to summarily describe a model’s recall (sensitivity or true positive rate) and false positive rate (FPR), calculated as 1 minus specificity (figure 28). To generate the ROC curve, recall is plotted on the y-axis, and FPR on the x-axis. In our model the false positive rate was 0 and the recall was 0, showing that my superhuman power was futile.
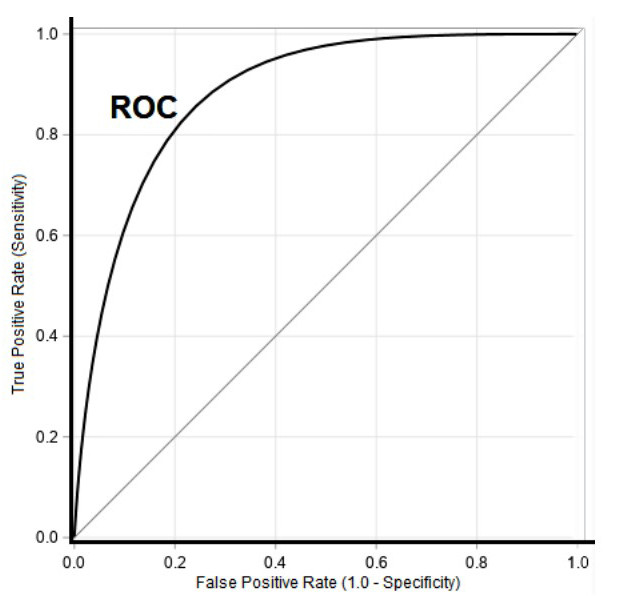
Figure 28: ROC Curve [21].
Area Under The Curve (AUC): Area under the curve, depicted in figure 29, is perhaps the most commonly used measure to summarize specificity and sensitivity (recall or true positive rate). It is a measure of the area bounded by a curve connecting the true positive rate (sensitivity or recall) with the false positive rate (1-specificity). The largest AUC that can be obtained is 1, which corresponds with a perfect model. An AUC of 0.5 describes a classification model no better than chance (figure 30).
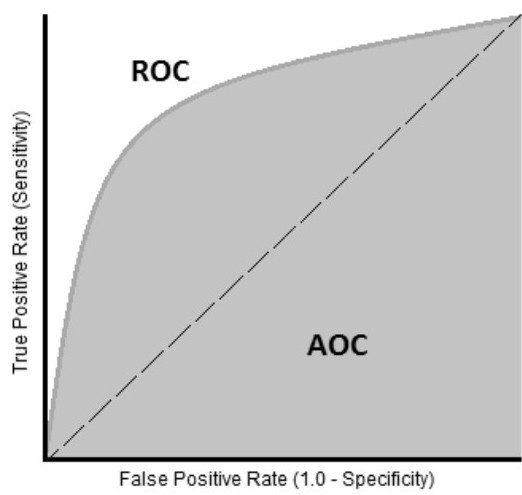
Figure 29: AUC Curve.
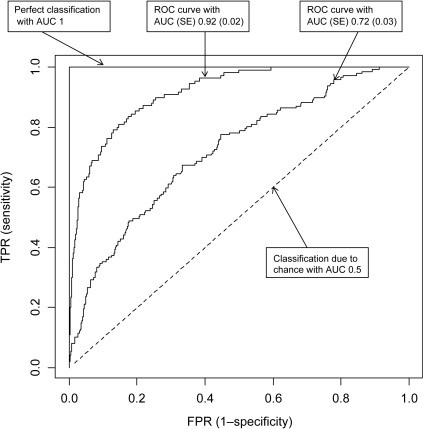
Figure 30: AUC Curves [22].
Using the Lamppost to Illuminate
In the wake of our melanoma dance marathon that left you exhausted; the next day you feel satisfied as you revealed my ruse. You acknowledge that I never lied to you and that my accuracy, negative predictive value, and specificity were 93%, 93%, and 100%, respectively, and my misclassification rate was only 7%. Nonetheless, you marvel at how awful my superpower really is. You note that the recall (sensitivity or true positive rate) was 0% and my precision was so bad it couldn’t be defined.
Remember to be Precise
As you reflect further on your interaction with me, you explore why my specificity, misclassification rate, negative predictive value, and accuracy rates were so high, even though it’s clear I have no melanoma detection ability. You immediately recognize this was due to the striking data imbalance in the data set you used to test my abilities.
You recall that of the 100 images you showed me, only 7 were melanoma. Therefore, there were far more true negatives (benign lesions) than true positives (melanomas). Accordingly, measures such as the specificity, misclassification rate, and negative predictive value, where the true negative value is in the numerator, will be high by default (figure 31).
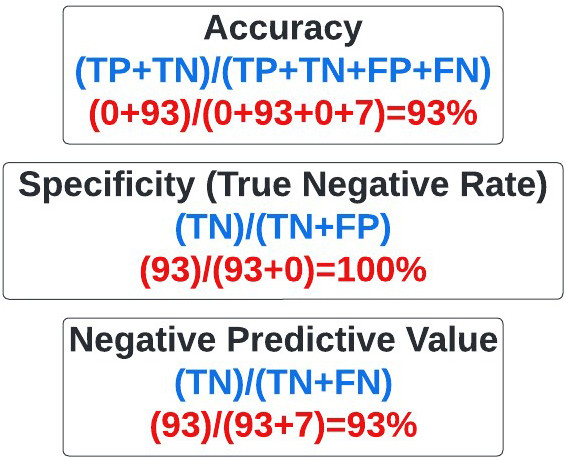
Figure 31: Statistical measures affected by imbalanced data sets with predominant true-negatives.
Ultimately, you conclude that when evaluating models where there is profound data imbalance favoring true negatives, it’s essential to inquire about precision and recall that emphasize identification of true positives (melanoma), which are in the numerator of the corresponding equations (figure 32). In fact, you vow to reflexively ask about precision and recall when a company approaches you for investment in the future.
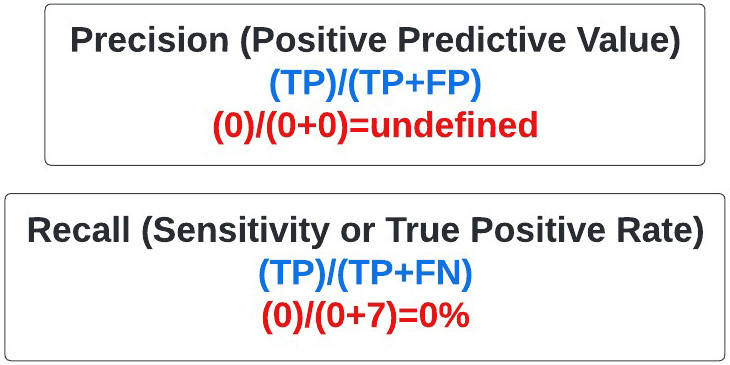
Figure 32: Statistical measures used when there is data imbalance involving large numbers of true negatives.
When Confused about Accuracy, Remember to be Precise and Specific, but not too Negative about AUC and F1, is a pneumonic you develop to help you address classification based products in the future.
A nagging feeling
Something is bothering you. The next morning you call Tony Stark, a brilliant man and head of STARK industries, to inquire why he invested in my superpower. When you ask Tony why he invested 2 million dollars in me at a 10-million-dollar valuation, he tells you he doesn’t know who I am. After talking more, he realizes that Happy, his colleague, must have agreed to fund my project without talking to him because apparently, he was off gallivanting with people named Peter Parker, Dr. Stephen Strange, and Peter Quill. He tells you some outlandish story of someone named Thanos, and you roll your eyes. You exchange pleasantries and hang up the phone. After all, you now have four melanoma detection companies asking for an investment from you.
Drowning in Data
We live in a world where people often make claims and then prove them later. The truth frequently feels subjective, and it’s very common for politicians to employ the strategy of telling a lie so frequently that people believe it’s true. It’s important to have a rigorous construct to assess claims made by individuals, companies of all types, etc.
The clinical world, particularly in cancer, is undergoing tremendous upheaval with the advent of cellular therapies, multiomics, cell free DNA based tests, AI/ML platforms, etc. Recently, Paige had their prostate pathology AI FDA approved as an adjunct method pathologists can use to determine if patients have prostate cancer. Numerous AI based platforms contend they can read MRIs, CTs, PET CTs, etc., better than radiologists, and they appear to be correct (23-24). Indeed, as we discuss later, you are now faced with two AI companies claiming they can distinguish melanoma lesions from benign ones better than dermatologists.
The classification confusion matrix and associated measures we discussed will be immeasurably useful to you in evaluating claims made by healthtech, genomics, and pharmaceutical companies in the future. In the very next article of this series, we will apply the knowledge you gain here to unabashedly dissect claims made by cell free DNA companies that they can adequately screen patients for cancer with a simple blood test. Foremost among these is GRAIL, a company purchased by Illumina, that contends their Galleri blood test can identify if patients have one of 50 different cancers long before they would become clinically detectable with conventional imaging, blood tests, etc. [25]. To this end, the little bit we discussed above will go a long way in enabling you to separate fact from fiction in a hyperbolic world.
Channeling your inner Hermione Granger
To assist you in determining which, if any, of the four melanoma detection companies you should invest in I ask you to channel your inner Hermione Granger.

Figure 33: Harry Potter talking to Hermione Granger [26].
To this end, in Harry Potter, Deathly Hallows Part 1, when Harry refers to Hermione as brilliant, she replies, “I'm highly logical, which allows me to look past extraneous detail and perceive clearly that which others overlook" (figure 33).
There are multiple rubrics one can use to consider investing in a business or even starting a business. Business schools have entire classes on how to build a business plan, and how to analyze a potential investment. I've taken several of them, and they were excellent. In fact, I will draw from some of them in future articles in this series. However, the simplest construct I've ever seen for determining if a venture is worth pursuing or not is something I learned when I was 12 years old, and is in line with channeling your inner Hermione.
The Harm / Inherency / Plan / Solvency / Disadvantages Rubric
When I started high school at Apple Valley High School in Minnesota at the age of 12, I immediately joined the policy debate team. In policy debate there are two teams, affirmative and negative, that debate a resolution (figure 34).

Figure 34: Policy debate round with affirmative and negative teams [27].
The affirmative team supports the resolution with a plan they devised, and tries to convince the judge of the competition they have the best position and to implement their plan. In contrast, the negative team contends the resolution is false and/or the plan will not succeed, and compels the judge to reject the affirmative plan and award them the round.
In my four years in high school competing in policy debate the resolutions included:
1988-1989: Resolved: That the federal government should implement a comprehensive program to guarantee retirement security for United States citizens over age 65
1989-1990: Resolved: That the federal government should adopt a nationwide policy to decrease overcrowding in prisons and jails in the United States.
1990-1991: Resolved: That the United States government should significantly increase space exploration beyond the Earth's mesosphere.
1991-1992: Resolved: That the federal government should significantly increase social services to homeless individuals in the United States.
In a typical debate competition year, one participates in hundreds of rounds, alternating between affirming the resolution with a conceived plan, and negating it. Teams are assigned a position at the beginning of the round having prepared to argue either position prior to that.
The affirmative team presents a plan to support the resolution and to address the problem underlying it. The basic construct (figure 34) used to affirm the resolution has stayed with me to this day and is a facile way to assess investments, develop proposals, write grants, etc.
Affirmative Plans are comprised of four primary sections (figure 35):
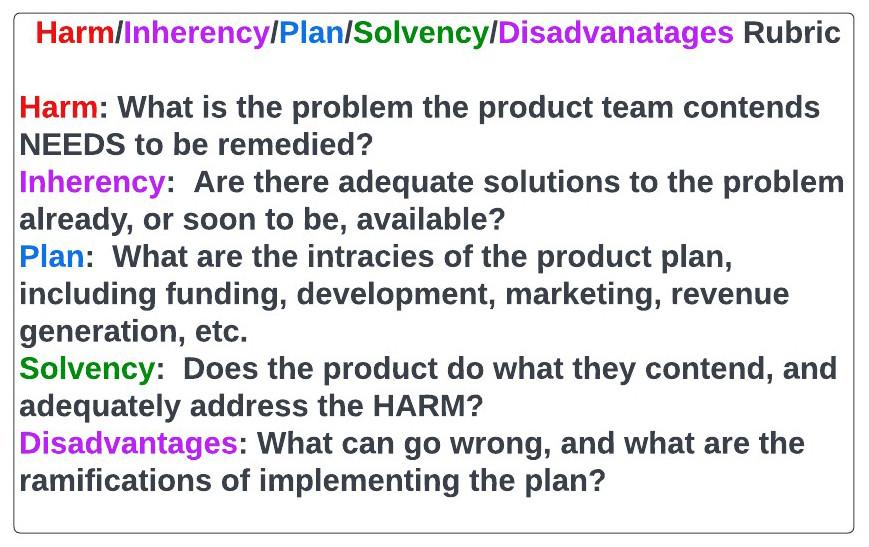
Figure 35: Simple Harms/Inherency/Plan/Solvency/Disadvantage Rubric for assessing business plans, grants, etc.
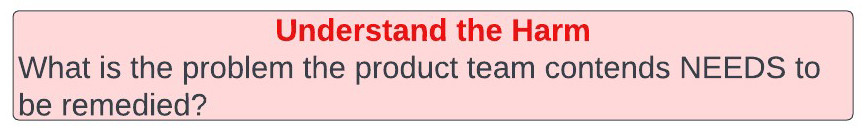
Harm is as it sounds and refers to present problems, and their impact on humanity, that must be addressed. For example, when debating the utility of space exploration, we cited climate change and the impending destruction of Earth as a harm that must be addressed.
Inherency refers to the status quo, including all presently, or soon to be available, options to address the harm. Specifically, the affirmative team presents the current state of affairs in the context of the problems, and explains there is no available option to remedy the harm.
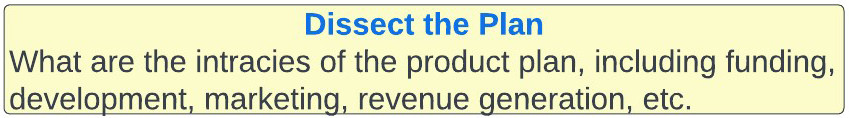
Plan is self-explanatory and entails a nuanced description of how the affirmative team intends to resolve the harms they presented in the context of an inadequate status quo, as stated in inherency. The plan section is very detailed, and includes funding, rollout, infrastructure, etc. It is largely beyond the scope of this article, but we will focus on it more in the future.
Solvency entails the proof presented by the affirmative team their plan is solvent and will adequately resolve the harm in a way the status quo doesn’t based on inherency.
After the affirmative presents their proposal, comprised of the aforementioned four sections, the negative team presents their rebuttal. They can choose to attack any, or all, of harm, inherence, plan, or solvency to demonstrate the affirmative plan shouldn’t be adopted. In addition, and this is critical, they can present disadvantages. Disadvantages refer to bad outcomes the negative team feels will arise from the affirmative team's plan. For example, a negative team may contend that if the affirmative team's plan of discovering aliens on another planet succeeds, the aliens would be alerted to our presence and destroy Earth. Ultimately, through poking holes in the affirmative team's harm, inherency, plan, or solvency arguments, and/or showing the disadvantages of the affirmative plan outweigh the harm it addresses, the affirmative team’s plan is rejected and the negative team wins the round.
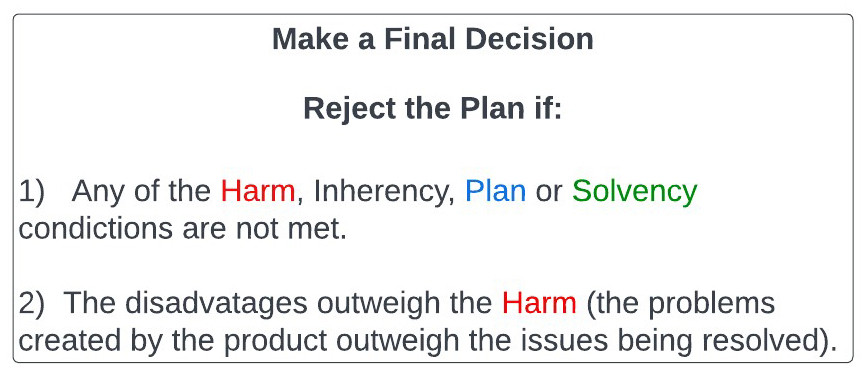
Putting the rubric to work
When employing the harm, inherency, plan, solvency, disadvantage rubric, you will reject the plan (model) proposed to you if:
1: Any of the Harm/Inherency/Plan/Solvency conditions aren't met.
- If the harm one is trying to solve isn't substantial enough, It's not worth your time or investment.
- If the inherency argument falters because the status quo is already addressing the harms presented, or is better than what is being proposed, you cannot accept the proposed plan.
- If the plan presented is intrinsically flawed, obviously you wouldn't fund it.
- If the proposed plan isn’t sufficiently solvent, and fails to rectify the harms, you cannot adopt or invest in it.
2: If the disadvantages outweigh the harms remedied by the proposed plan you cannot accept it.
Simply put, if you are creating worse problems than you’re solving that’s an issue.
If you take a moment to consider harm, inherency, plan, solvency, and disadvantages, you will realize they constitute a simple, yet effective, thought construct to analyze many things in life, including business plans, grants, investments, etc. We will use this construct here, and in many future articles in this series.
An investment to be made?
Let's apply the aforementioned rubric to build another one, this time incorporating methods of assessing the solvency of a proposal. We will use this in a regimented and easily extrapolated fashion, when considering our melanoma investment conundrum, as illustrated in figure 36.
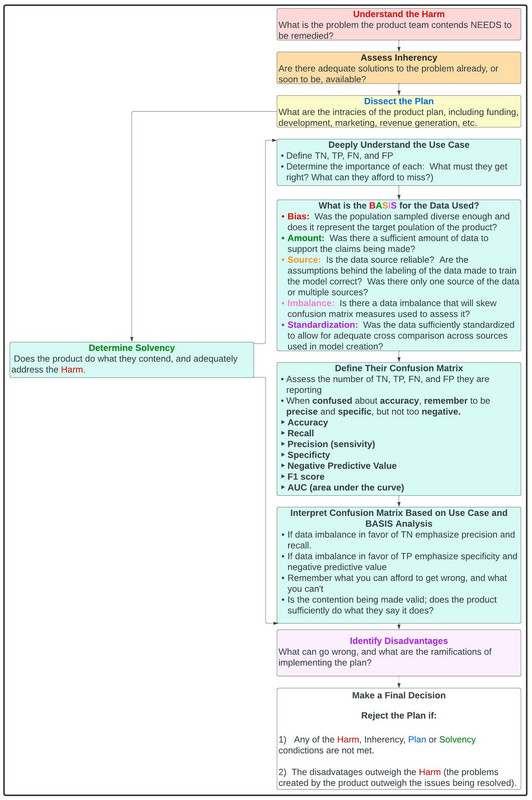
Figure 36: Comprehensive rubric for assessing investments, business proposals, etc.
The Affirmative Team
In this case all four companies, DermTech, Melanoma AI, AustralianAI, and Cancer Canines, are acting as the affirmative team supporting the resolution with various proposed plans, they want you to affirm as the judge.
The resolution itself is: Resolved: That the medical field should adopt a new method of melanoma detection.
From a hypothesis testing perspective, consider the resolution the alternative hypothesis, with the null hypothesis being that the current methods of detecting melanoma are adequate.
You, as the investor, must be cynical and do what you can to poke holes in the affirmative team's case. You represent the null hypothesis, that current methods of melanoma detection are adequate. You need substantial proof the resolution is wrong and the affirmative plan is viable to agree to fund the affirmative team.
Another way to think of this is that, whereas in the criminal justice system people are presumed innocent until they are found guilty, the affirmative team looking to obtain an investment from you is guilty until proven innocent. The default is that the statements they are making are wrong until they can prove otherwise. They must prove the alternative hypothesis and show you the null hypothesis, not making an investment, needs to be rejected.
As the round begins you watch the affirmative teams, DermTech, Melanoma AI, Skin Analytics, and Cancer Canines present their cases, including harm, inherency, plan and solvency. They all have the same harm arguments. They rightfully contend that 96,480 patients were newly diagnosed with melanoma, and 7,230 died of the disease in 2019 (28-29). Over 90% of patients with melanomas caught early, when the cancer has a thickness of less than 1 mm, are alive 5 years after diagnosis. However, this number sharply declines with increasing depth or spread of the disease, as only 62% of stage 3, and 18% of stage 4, melanoma patients are alive in 5 years, respectively. Moreover, the financial cost to society of not detecting melanoma early is substantial as there is a 20-fold increase in treatment cost from early to late-stage melanoma. Indeed, there are drugs we use in melanoma, such as ipilimumab, that cost up to 150,000 dollars for a four-dose treatment course. Other immunotherapies used in the disease, such as keytruda, opdivo, and tecentriq, can cost as much as 120,000 dollars per year per patient. The companies reference the cost to society of human work hours lost, lives lost, etc. They speak of the emotional toll melanoma takes on the patient and loved ones, and how devastating the disease remains. They smartly point out that, even though we've made significant progress in stage 4 melanoma, with the approval of BRAF and MEK inhibitors, TVEC, and immunotherapy, including PD1, PD-L1, CTLA4, and LAG3 inhibitors, we remain abysmal at saving metastatic melanoma patients who ultimately progress on these therapies.
After completing their harm arguments, all four companies present the inherency facet of their case. They reference a status quo that is wholly inadequate at melanoma screening and detecting melanoma early in people throughout the world. They correctly point out the protracted shortage of dermatologists and how one can't get an appointment with a dermatologist in many places in this country for many months. The teams report that current melanoma screening is largely restricted to skin exams, performed by dermatologists, during which pictures of lesions may or not be taken. They state that the ABCDE (asymmetry, border, color, diameter, evolution) rubric for determining if a mole is cancerous or not is crude and imperfect. They smartly point out that dermatologists, in some studies, have a sensitivity and specificity of 71% and 59%, for identifying if a suspicious pigmented lesion is malignant or benign [30]. Moreover, one can see diagnostic discordance as high as 38% between dermatopathologists evaluating patient samples under the microscope [31].
After hearing the teams harm and inherency arguments, each team presents their plans, including the underlying methodology, marketing and manufacturing plan, technology, funding etc.
DermTech shows you the Smart Sticker they've invented. They go over the cost of the sticker, the margin, the dermatologist network they've established to use it, the procedure behind it, etc.
Melanoma AI shows you the program they're using. They tell you it involves a deep convoluted neural network (DCCN), but refuse to show you the exact configuration of it because they contend its proprietary.
Skin Analytics presents their specific detection method, but also refuse to disclose the configuration of their AI neural network. They do however tell you they feel theirs is better than the one created by the MIT group. They are also displeased as they correctly point out the Melanoma AI didn’t cite their work in the Science Translational Medicine paper they published. Having read that paper, you are acutely aware Melanoma AI very much intentionally omitted that Skin Analytics had a melanoma AI that was published two years before theirs and is very visibly being employed by the NHS in the UK.
Cancer Canines brings out Bella, a 11-year-old rescue miniature pinscher/chihuahua mix (figure 37), who is formally trained in detecting melanoma. She is docile and kind and continuously sniffing you. You worry because she is fixated on a mole on your forearm, but try not to let it distract you.

Figure 37: Bella (left), my other rescue dog, pictured with my twin boys, and Bolt.
After hearing the detailed plans of the four groups before you, much of which was not discussed here, each company now shows you the supportive evidence for their claims in the solvency section of their plans
DermTech tells you their test has a negative predictive value (NPV) of 99%, sensitivity of 91%, specificity of 89% and AUC of 0.9, without disfiguring the patient with biopsies [32].
Melanoma AI contends they have a NPV of 99%, specificity of 90%, AUC of 0.97, and predictive value of 99% [33].
AustralianAI states they have an NPV of 99%, sensitivity of 100%, specificity of 65%, AUC of 0.95, and that the UK NHS has used them for the last two years [34].
Cancer Canines reports a 45% accuracy rate in melanoma detection [35].
The negative team
You are very impressed by the claims made by the four companies and feel they have solid arguments. However, you hired Cancer Clarity to serve as the negative team in support of the null hypothesis, and want to hear what they have to say.
For the sake of this exercise, we will say that I, Basem Goueli, represent the Cancer Clarity team in this regard. I refer to the rubric above.
As I stand up to present my argument, I very quickly tell you that I grant to all four teams their harm arguments. I, as a cancer doctor who has published in melanoma and currently care for several stage 4 melanoma patients, have no disagreement there is a need for improved melanoma screening and that melanoma can be a devastating disease.

Next, in assessing the team’s inherency arguments, I have no counterargument for the notion that the status quo is inadequate.
In terms of each groups plan I initially forego teasing out all the details regarding cost, rollout, margins, etc. Indeed, if I can prove these four companies have products that don't adequately solve the problem they intend to, it doesn't matter how great their plan is. Accordingly, I hone in on the solvency aspect of each company’s proposal.

Having prepared for the competition against all four companies I come armed with ample research I did in the weeks prior to the tournament.
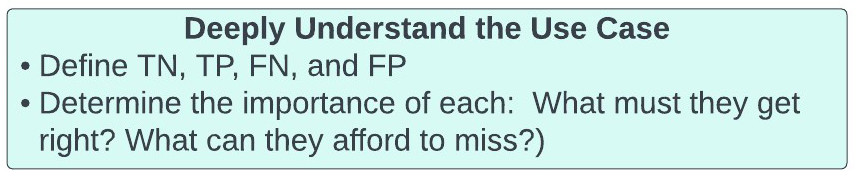
We begin our solvency assessment my developing a deep understanding of our use case. We define true positives (TP), true negatives (TN), false positives (FP), and false negatives (FN):
- TPs (predicted positive same as actual positive) = correct identification of melanoma or SPLs.
- TNs = correct identification of lesions as not being melanomas or SPLs
- FPs = misidentification of lesions as being melanomas or SPLs that are NOT melanomas or SPLs
- FNs = misidentification of lesions as NOT being melanoma or SPLs when they are.
We now determine what we must get right with our model, and what we can afford to miss. In melanoma detection what we absolutely cannot do is tell a patient they don’t have melanoma or an SPL when they do. Their melanoma would go untreated with potentially catastrophic consequences. Therefore, the most important facet of our confusion matrix is the FALSE NEGATIVES (FNs). Of course, false positive results are not ideal as patients will be subjected to biopsies they don’t require. However, the physician will not treat for melanoma solely based on the model’s prediction. The requirement for biopsy confirmation will prevent patients from being harmed by unnecessary surgeries or treatments, beyond the biopsy itself.
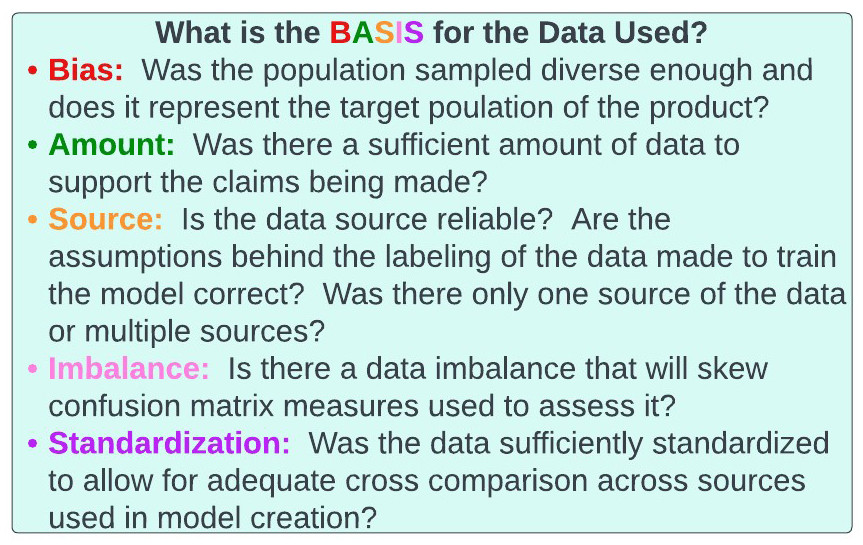
Figure 38: BASIS acronym for assessing data.
It's now time to assess the data underlying each company’s solvency claims. To do this we consider another rubric we will use, the BASIS acronym (figure 38). Indeed, we will be using this BASIS paradigm to assess genomics, healthtech, and pharmaceutical companies in the future. Specifically, as companies, especially AI/ML based ones, are entirely reliant on data to generate their core technology, we will use the BASIS acronym to assess the data they used.
The BASIS of the data
Denzel Washington, when asked about the media, once said, “if you don’t watch the news you’re uninformed, if you do, you’re misinformed”. Some would say that if you don’t pay attention to statistics you’re uninformed, but if you do, you’re misinformed. To ensure one is not misinformed, one must assess the data utilized by the company of interest with a regimented framework.
The BASIS acronym (figure 39), depicted below, is a way to evaluate data underlying models and products that are generated.
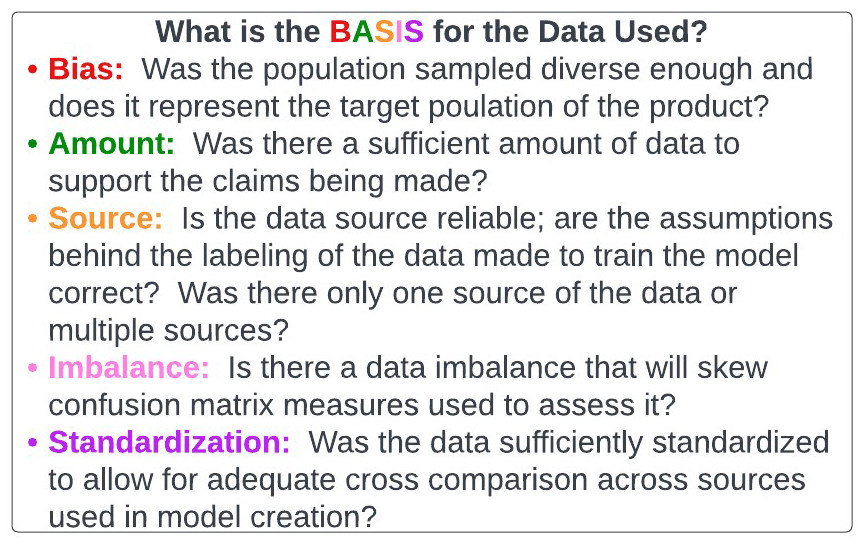
Figure 39: BASIS acronym for assessing data.
Bias: With cell-free DNA, healthtech, etc., we are witnessing individuals make grandiose claims based on studies they conducted on various data sets. It’s imperative investors, healthcare practitioners, etc., proceed with the null hypothesis the tests are inherently flawed. The alternative hypothesis, where the burden of proof is on the company of interest, is that the test can do what they say it can. One immediate question that must be asked is whether the data used is representative of the target population. We will discuss this in the context of cell-free DNA in the next article of this series, but let’s apply this to our melanoma conundrum.
Every company in melanoma detection requires a labeled data set that designates skin lesions as malignant or benign to train and validate their prediction model. Questions related to bias in melanoma training sets include, but are not limited to:
- What Fitzpatrick skin types and skin colors were represented in the data set (figure 40)? If the data set was only collected from people with lighter skin, it may not be applicable to individuals with other skin tones.
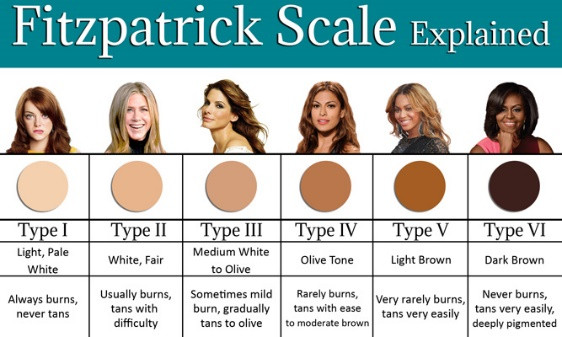
Figure 40: Fitzpatrick skin types [36].
- Was there a representative sample of non-melanoma skin lesions, including those that can be confused with melanoma? This may include squamous cell carcinoma, basal cell carcinoma, dermatofibroma, atypical nevi, etc. One can envision a scenario where the normal samples were too homogeneous, thereby precluding the model from effectively distinguishing melanoma from non-melanoma in real-world settings.
- Were different types of melanoma adequately represented? There are many types of melanoma, including nodular, lentigo maligna, and the most common, superficial spreading. These have very different appearances (figure 41). If the data set doesn’t include them all it may miss melanomas of a certain type.
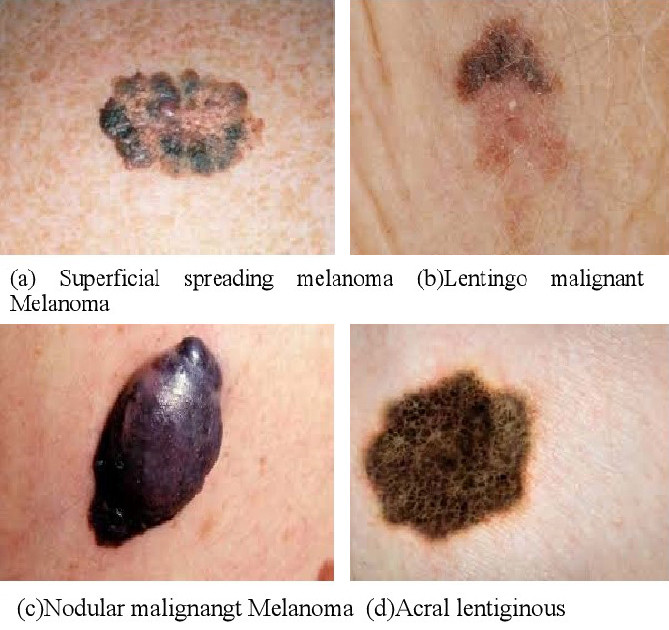
Figure 41: Appearance of different types of melanoma [37].
- Were different sizes and appearances of melanomas represented? Some melanomas are large in diameter, whereas others are small. Some are black (most common), dark brown, pink, etc. (figure 42). Some are raised, whereas others are superficial. If the data sample isn’t heterogeneous enough it will have problems when broadly applied.
Figure 42: Melanoma can appear in multiple shapes, colors, and sizes [38].
Amount: The "A" of BASIS stands for amount. This is relatively self-explanatory, but the amount of data used in generating the melanoma model is critical. If one is truly discriminating between melanoma and benign lesions, it’s imperative the model sees all permutations of melanoma and benign, so as to not make a mistake. Obviously, the larger the amount of data available the more likely this can happen. Importantly, there is no magic number as to how much data is required to generate a model.
Source: The first "S" of BASIS pertains to the source of the data. Again, this is self-explanatory, but a thorough assessment of the sourcing of data used to generate a model is critical. Imagine if the data used by the AI was labeled by a group of children deciding if they felt a mole was malignant or benign, without biopsy confirmation. Any model based on this is likely to be deadly wrong. More realistically, as it pertains to our melanoma discussion, an evaluation of the pathologists designating a mole as malignant or benign in the labeled data set is necessary, particularly as studies have shown up to a 38% discordant rate among dermatopathologists in melanoma diagnoses. Importantly, it’s usually preferred to obtain data from multiple reliable sources, as opposed to one. There may be something about the way a site takes pictures of lesions, identifies patients to be assessed, etc., that can cause the model to fail in real world settings involving numerous sites.
Imbalance: The "I" of BASIS refers to imbalanced data sets. We discussed this in the melanoma dance above, but if there is tremendous imbalance in the data many of the common statistical measures are largely useless. As above, in a situation where there are a lot true negatives, precision, recall, F1 score, and AUC are much more important than accuracy, specificity, and negative predictive value. In contrast, if the data imbalance leans towards a preponderance of true positives, specificity and negative predictive value will be critical, and accuracy, sensitivity, and positive predictive value less so.
Data imbalance is so unbelievably important to recognize because most real-world use cases are affected by it. Consider our melanoma example. Experts estimate that fewer than one in 10,000 moles will become melanoma. Therefore, if we look at 10,000 moles in the real world setting only ONE will be a melanoma. Consider the confusion matrix here for a moment, assuming we get everything correct (figure 43).

Figure 43: Real world melanoma Confusion Matrix
Here, there is only 1 true positive out of 10,000 samples. Let’s say we say everything is negative and we miss the one cancerous mole. Our negative predictive value would 99.99%, accuracy 99.99%, specificity 100%. Our recall would be telling and would be 0, just as above. The melanoma example we discussed above was already exaggerated, but the melanoma real world case is even worse.
Standardization: The last "S" in our BASIS acronym is standardization. Data generally isn’t provided in nice packages. It’s often messy and unstandardized. This is problematic as it’s difficult to develop a model on unstandardized data. In this case one can envision a scenario where different institutions may label the pictures differently, use different cameras, take pictures of moles at different angles, or different pathologists may have different diagnostic approaches to melanoma.
Although we will apply the BASIS algorithm to the four companies we’re evaluating, it can be applied to essentially every use case. Of note, assessment of data quality is intrinsic to the BASIS paradigm.
The true debate begins
With the BASIS algorithm in hand, as the negative team, I now go on the attack and assess the remainder of each company’s Solvency in succession, per the rubric in figure 36.
DermTech
DermTech claims their Smart Sticker for melanoma detection has a >99% negative predictive value, sensitivity of 91%, specificity of 69%, and AUC of 0.9. The authors of the paper publishing these results placed tremendous emphasis on negative predictive value and feel it’s the most important measure of the assay. However, they are incorrect in this assertion because of the negative imbalance associated with melanoma we discussed previously. Overall, only 1 in 10,000 moles is melanoma. Only 0.8% of SPLs biopsied are melanoma [39]. Therefore, the true negative rate in the numerator of the negative predictive value equation is high and the NPV is high by default. Accordingly, the measures we are very interested in are the precision (positive predictive value), and the recall (sensitivity). A sensitivity of 91% is excellent; precision isn’t given. However, the AUC of 0.9 suggests the precision is good. Now, it’s time to assess the BASIS of the data DermTech used to assess their model.
Data presented: DermTech validated their Smart Sticker on 398 pigmented lesions, selected by dermatologists, which were tested with their PLA assay using their sticker, and subsequently biopsied. Final diagnosis of the lesion based on biopsy was determined by 3 experienced dermatopathologists who determined if a lesion was melanoma or not. Of the 398 pigmented lesions, 87 were melanomas, and 311 were non-melanomas. Of the 87 melanomas, 57 were superficial spreading, 13 lentigo maligna, and 15 hybrid. There were no nodular melanomas.
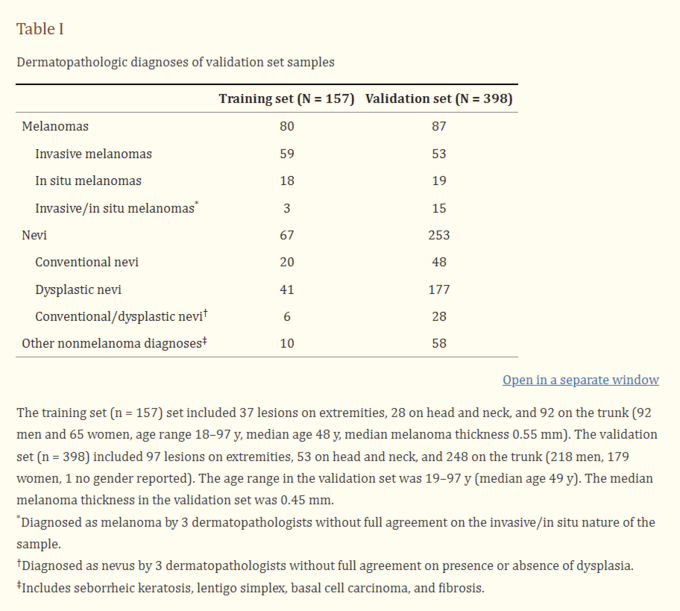
Figure 44: Breakdowns of melanoma subtypes in DermTech study.
The median thickness of the melanomas was 0.4 mms, and included melanoma in situs that were not invasive and cannot spread, suggesting the company was focused on very early melanomas (figure 44). Samples were obtained from 28 institutions throughout the world. Most lesions were acquired from patients with white skin, and were well distributed between the head and neck, extremities and torso. Patients with lesions on the soles of the feet, hands, and mucous membranes were excluded from the study. Lesions had to be greater than 4 mms in diameter, and patients couldn’t have ongoing skin conditions, or recent skin related treatment. Males and females were well represented in the patient population.
BASIS of the data:
Bias: The sample set is relatively diverse as it contained atypical nevi, melanoma in situ, and invasive melanoma. It had lesions from various locations and the final biopsy diagnosis was made by three independent dermatopathologists, who incidentally couldn’t come to a consensus on 11% of samples.
The sample size didn’t include a sufficient number of non-white patients to be generalizable to them. It also didn’t include patients with ongoing skin disorders or skin treatments, nodular melanomas, lesions less than 4 mms in diameter, or lesions on the hands, soles of the feet, or mucous membranes.
Ultimately, we conclude the sample size was reasonably unbiased (diverse), but the aforementioned issues are present.
Amount: The validation sample size was 398 and included 87 melanomas. Undoubtedly, one would like more testing even though the p-value for the study was less than 0.05. However, the study is decent, given how difficult it is to obtain the necessary samples.
Source: Samples were obtained from 28 different institutions throughout the world from reputable dermatologists who identified the lesions to be tested. Interestingly, 14% of samples obtained had to be discarded because they didn’t have sufficient skin cells to run the PLA test, presumably due to user error. Nonetheless, it appears the source of the DermTech data was good.
Imbalance: As aforementioned, we are vehemently focused on data imbalance in melanoma detection studies. 87 (21.9%) of the 398 samples tested were melanoma. Given that 1 in 10,000 moles are melanomas and only 0.8% of suspicious pigmented lesions are melanoma, this data set is more balanced than others in melanoma.
Standardization: Investigators had a regimented protocol around sample acquisition and the procedures were highly standardized, allowing for institutional cross comparison.
Ultimately, having completed the BASIS assessment, although I have some arguments we can pose, I feel DermTech’s underlying data set was adequate.
Moving on to the final facets of the DermTech solvency analysis, we define the confusion matrix measures.
Recall that DermTech’s technology relies on testing skin cells removed from a patient’s skin lesion for the expression of two genes, LINC00518 and PRAME, that are preferentially expressed in melanoma (figure 45).
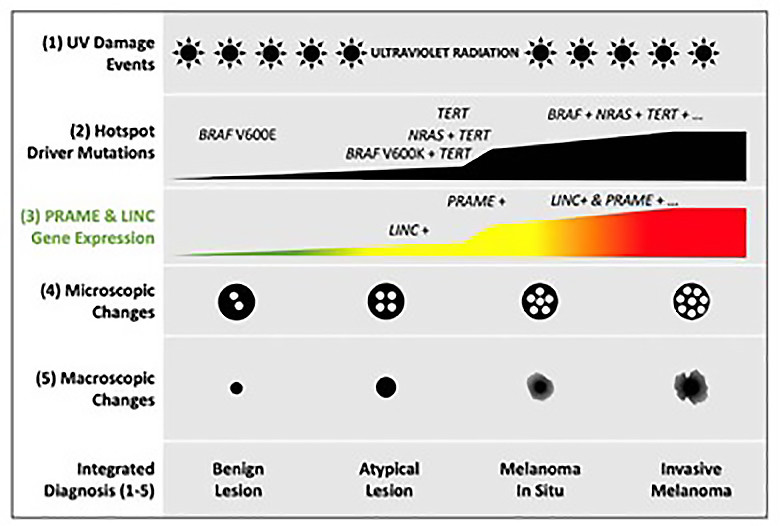
Figure 45: Preferential Expression of LINC00518 and PRAME in melanoma evolution (40).
Figure 46 demonstrates that 66 of the 87 melanoma in their validation set expressed both genes, 13 expressed 1 of 2, and 5 none. This enabled them to make the predictions depicted in figure 46, resulting in 91% sensitivity and 69% specificity. The negative predictive value was calculated at 99% on 7% prevalence.
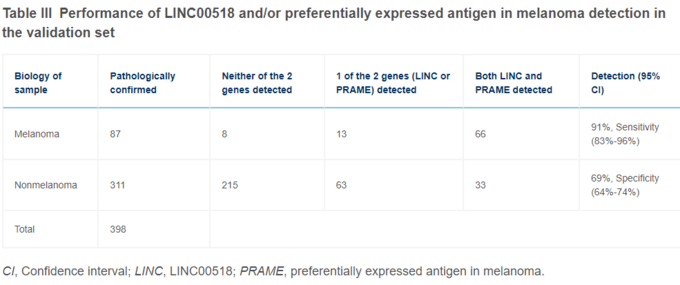
Figure 46: Preferential expression of LINC00518 and PRAME in samples tested with Smart Sticker.
DermTech reports an AUC of 0.9 in the validation set (figure 47).
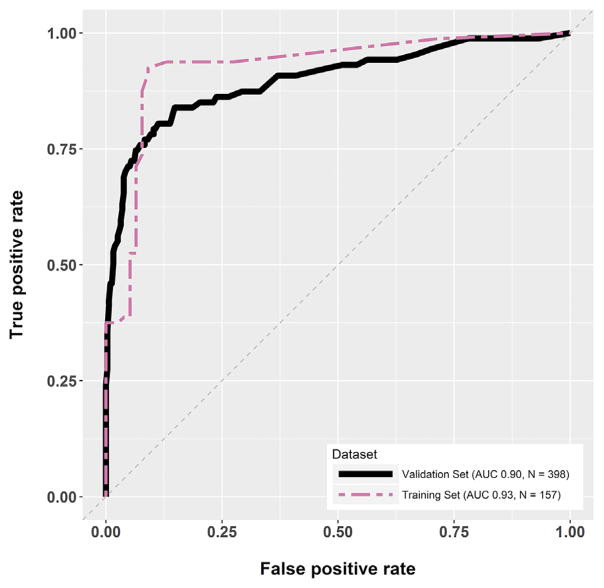
Figure 47: AUC for DermTech Smart Sticker.
Ultimately, given the inherent negative data imbalance in melanoma detection, and that 79% of the samples tested were not melanoma, we very quickly hone in on precision and recall (sensitivity). Sensitivity is excellent at 91%. Recall, although not specifically given, appears to be decent as well; I didn’t take the time to calculate it. Interestingly, the false positive rate is a bit high with a specificity of 68%. However, we are willing to live with this as our major concern is false negatives, nicely depicted in sensitivity, not false positives, which is illustrated in specificity. We can live with patients being over biopsied, but not them being under diagnosed.
Overall, after completing your solvency assessment of DermTech you are fairly impressed.
Melanoma AI
Melanoma AI is predicated on a deep convoluted neural network (DCNN) that can identify suspicious pigmented lesions (SPLs) from wide images. They contend a primary care physician could take a picture of the patient’s entire back and their AI will identify lesions of concern. Thereafter, the lesions would be formally assessed and biopsied by a specialist.
Melanoma AI utilized 38,283 pictures taken from publicly available images, including those acquired via web scraping, and 133 patients from Hospital Gregorio Maranon in Madrid, Spain. The pictures were taken with a variety of consumer grade cameras, largely without dermoscopy. The pictures were classified by 3 board-certified dermatologists, who confirmed if labels assigned to them on the internet or at the Spanish hospital were accurate.
The picture distribution included six categories (figure 48):
- Backgrounds (8,888): Photos of items such as chairs, tables, etc., that one would find in an exam room.
- Skin edges (2,258): Pictures comprised of various skin edges that didn’t contain pigmented lesions.
- Bare skin section (10,935): Pictures from different skin regions without pigmented lesions.
- Nonsuspicious pigmented lesions (NSPL) type A of low priority (10.759): non-cancerous skin lesions of low suspicion for malignancy, including nine subtypes where low-priority management is indicated.
- NSPL type B [1110] of medium priority: Skin lesions that are non-suspicious, corresponding to five skin abnormalities where medium-priority management is indicated.
- SPLs [4063]: Lesions that are suspicious for skin cancer, including stage 0-4 melanomas [2906], squamous cell carcinoma [589], and basal cell carcinoma [568].
The majority of the SPL pictures were of white skin. They were not independently validated as being biopsy proven melanoma or not. The majority of them were from anonymous sources, so the underlying characteristics of the patients whose lesions were captured is largely unknown.
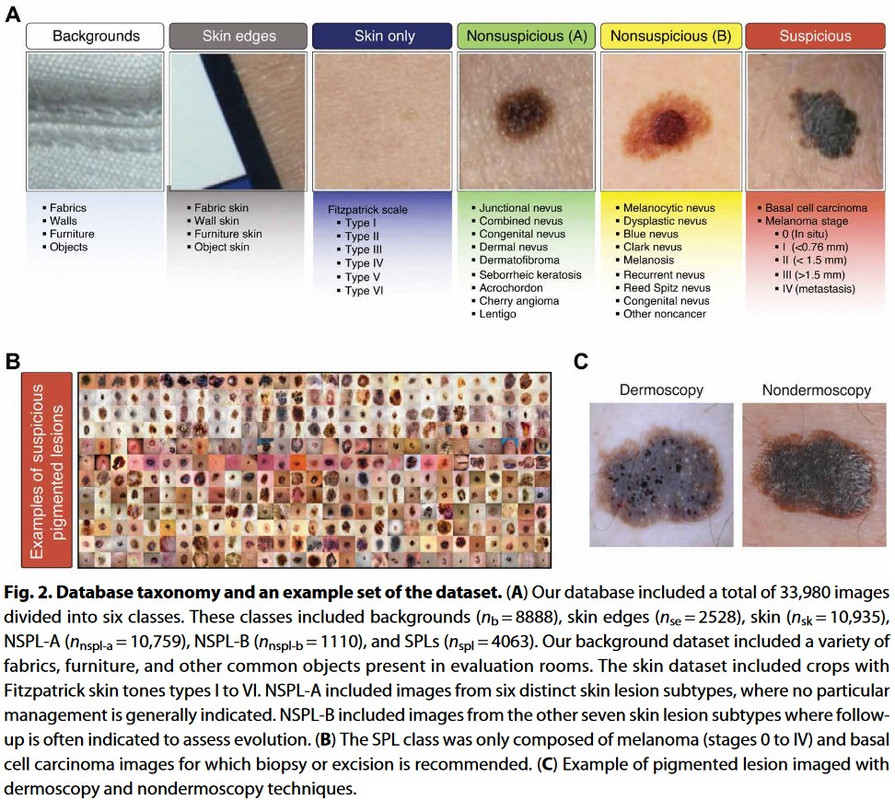
Figure 48: Different picture classes used in Melanoma AI generation.
BASIS of the data:
Bias: There is concern the majority of the SPL pictures were of white skin. However, there seems to be sufficient diversity in the lesions assessed, including 14 non-malignant pigmented lesions, basal cell carcinoma, squamous cell carcinoma, and all stages of melanoma. The pictures were obtained from innumerable sources, including Hospital Gregorio Maranon in Madrid, Spain. It’s unclear how many SPL pictures were from women or men, but it does appear the picture sample for the NSPL-type A, NSPL-type B and SPLs was sufficiently diverse
Amount: The number of pictures used is sizeable, but it’s important to note that 10.6% of them were SPLs, and 7.6% were melanoma. Nonetheless, the amount of skin lesion pictures used is impressive.
Source: This is likely the biggest concern regarding the data used. Initially, there are studies showing that many skin lesion pictures online are mislabeled as malignant or otherwise. In addition, as there is no biopsy data available for the pictures used, it’s unclear if the SPLs were actually malignant or not, even though they appeared to be by three independent dermatologists. This is a critical issue as one can imagine a scenario where the model was trained on lesions that were misclassified, thereby making it error prone in real-world applications.
Imbalance: As above, only 10.6% of the pictures used are SPLs, and 7.6% were melanoma. However, this is reasonable given the nature of melanoma previously discussed.
Standardization: The nature of the data retrieval, including web scraping of numerous sites, resulted in data that was highly non-standardized. However, this is advantageous when training an AI model, and isn’t a significant issue in this study.
After numerous iterations of their DCNN, Melanoma AI settled on a configuration that demonstrated 99% negative predictive value, 90.3% sensitivity, 89.9% specificity, 86.56% accuracy, and AUC of 0.97 in distinguishing SPLs from other pictures. En face, that’s pretty impressive. However, it cannot be overstated that the pictures used didn’t have corresponding biopsy reports confirming whether they were malignant or not. It’s conceivable SPLs identified as melanoma based on appearance were not actually melanoma, which confounds the model.
Overall, as the use case for Melanoma AI is the acquisition of wide-angle pictures of patients in primary care clinics to identify SPLs, the data presented here is intriguing.
Skin Analytics
Skin Analytics, not to be outdone by the MIT group leading Melanoma AI, generated their Deep Ensemble for Recognition of Malignancy (DERM) AI algorithm for analyzing dermascopic images taken by smart phone and digital single-lens reflex cameras. They correctly state their AI is currently in use by the UK NHS to help identify SPLs in the clinic.
The primary data Skin Analytics cites comes from a study reported in Dermatology in 2019. 731 images comprised of 51 biopsy proven melanomas, 109 biopsy proven NON-melanoma lesions, and 571 non-biopsied skin lesions were used in the study. Pictures were taken at 7 UK hospitals, with 3 different cameras. The sample size included 279 women and 484 white patients. The patients had fair skin tones (Fitzpatrick 1-3). Most of the melanomas were superficial spreading (54%) or lentigo maligna (31%).
BASIS of the data:
Bias: Most of the samples were of fair skinned white patients. They were obtained at 7 different centers and the sex distribution was reasonable.
Amount: In contrast to the Melanoma AI data set, this data set only had 55 melanoma pictures, but very importantly, they were biopsy proven unlike Melanoma AI. The overall data set included 731 images.
Source: The data came from 7 reputable UK institutions and was acquired by trained professionals.
Imbalance: The data set of 731 images included 55 melanomas (7.5%), revealing significant imbalance, but this is expected with this use case.
Standardization: The data acquired was highly standardized.
The model identified melanoma lesions from non-melanoma lesions with an AUC of 0.95 for all lesions (0.906 for biopsied lesions), 100% sensitivity, and 64.8% specificity using iPhone 6s. AUC was 0.87 for biopsied lesions using the DSLR camera, and 0.86 using Galaxy S6. Negative predictive value for all devices was 99%.
Overall, the data presented by Skin Analytics is intriguing as the AUC is reasonable. There are issues with the amount of data available, use of only three Fitzpatrick skin types, etc., but there is merit in the DERM AI. Indeed, this is why the UK NHS adopted it.
Cancer Canines
Cancer Canines contends they’ve trained dogs to identify the presence of volatile organic compounds (VOCs), such as dimethyl disulfide and dimethyl trisulfide, that can distinguish melanoma lesions from non-melanoma lesions. They cite studies demonstrating these substances are emitted by melanoma, but not benign lesions. As canine olfaction can identify odorant molecules at up to 1 part per trillion (a magnitude more sensitive than the currently available gas chromatography–mass spectrometry technologies) and can detect the production of new VOCs or altered VOC ratios due to pathologic processes, Cancer Canines believes their dogs can be used in early detection of melanoma.
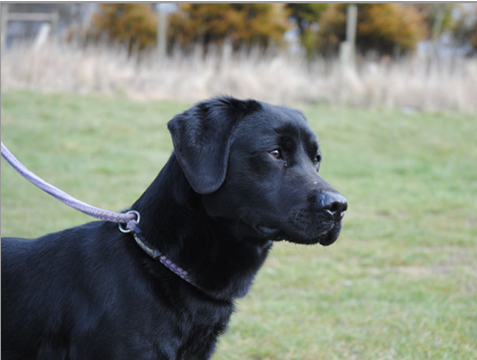
Figure 49: Ronnie, the honorary dermatologist.
They report a study where Ronnie, a 2-year-old Labrador (figure 49), was trained to identify melanoma lesions. The study conducted involved placing a patch on suspicious patient skin lesions with specialized processing to preserve VOCs emitted from them. The lesions were then biopsied to delineate if they were melanoma or not.
Ronnie, trained for 13 months on melanoma, was used to perform 20 double-blinded tests in which 10 samples were placed in front of him (9 non-melanomas and 1 melanoma) and he had to identify which one was melanoma. Samples were obtained from 741 patients, corresponding to numerous skin abnormalities (figure 50).
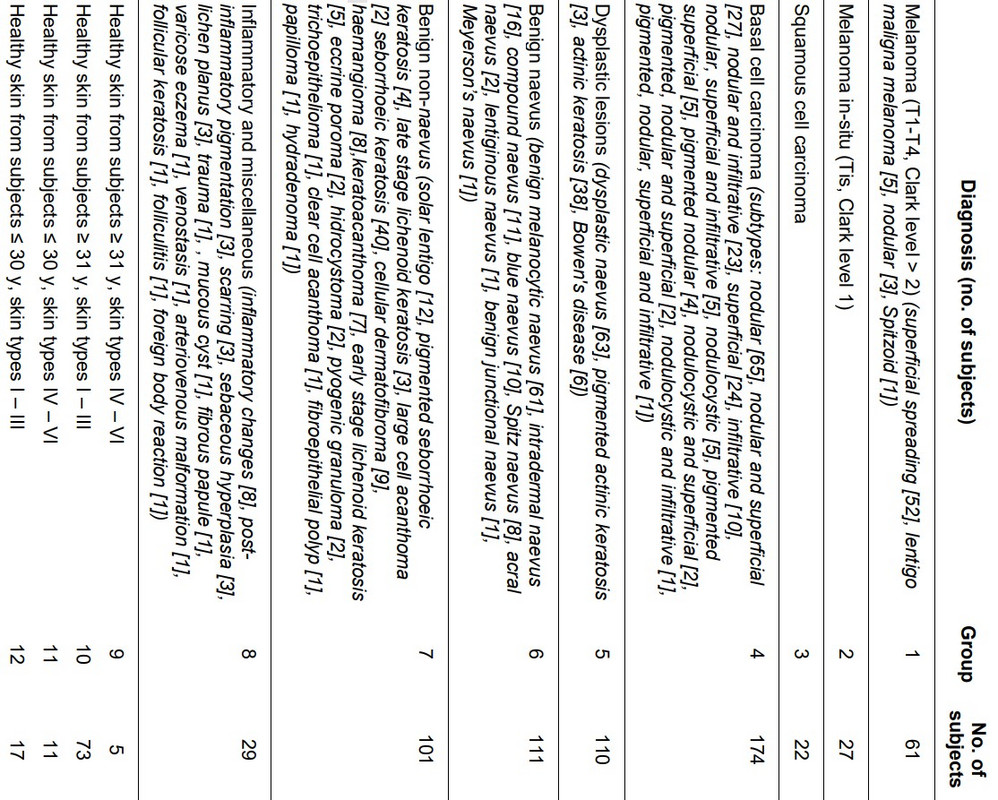
Figure 50: Skin lesions used in Cancer Canines study.
BASIS of the Data: Not a lot of details regarding the patient population are presented in the Cancer Canines paper, so we will forego this conversation.
Ultimately, and somewhat amazingly, Ronnie correctly identified the melanoma sample in 9 of the 20 double-blinded studies in which he had to select one of ten samples that was melanoma. This is actually remarkable.
The confusion matrix (figure 51) for detecting melanoma out of all the lesions Ronnie was presented with is:

Figure 51: Cancer Canines confusion matrix.
Based on this, Ronnie’s negative predictive value is 97%, specificity 97%, precision 45%, recall (sensitivity) 45%, etc. Ultimately, this is really good for a dog, but probably not good enough.
Disadvantages
After thoroughly evaluating the companies’ harm, inherency, plan, and solvency arguments, we now consider disadvantages of adopting of their respective plans.

With every company’s plan cost is a major consideration. Use of DermTech stickers, AI based methods, and canines is extremely expensive, but there is an argument to be made the savings incurred by early detection of melanoma can offset this. The primary disadvantage associated with any of these modalities is the false negative concern. It’s possible patients will get a false sense of comfort when informed they are negative by any of these modalities, and stop formally following up with a dermatologist. This would be catastrophic as patients would unknowingly be walking around with melanoma.
A dermatologist might contend that reliance on AI in melanoma may spiral into the rest of dermatology, and render them obsolete. This is a legitimate concern as Google’s Inception v3 architecture and ImageNet transfer learning bested 21 board certified dermatologists in the classification of 2032 different skin diseases using 129,450 biopsy proven dermatologic images. The Google DCNN had an accuracy of 72.1%, whereas dermatologists were 65.78% accurate.
Using a dog could be problematic if the dog bit a patient or attacked them.
Making a Final Decision
The disadvantages of a dog potentially biting a patient outweigh the benefit of using Cancer Canines, particularly based on their 45% precision and recall. As such, we will no longer consider them. However, the remaining three companies have viable affirmative arguments and don’t have glaring disadvantages that outweigh the harm (deaths from melanoma) they’re trying to solve. As such, you have some decisions to make.
A comparison of DermTech, Melanoma AI, Skin Analytics, and dermatologists is depicted below (figure 52). Please take the sensitivity and specificity associated with dermatologists with a grain of salt as these numbers feel too low to me, and were what I found in the literature. Important considerations, such as cost, time to develop, break even analysis, return on investment, etc., are not depicted in this table. You are being asked to make decisions based on this table.
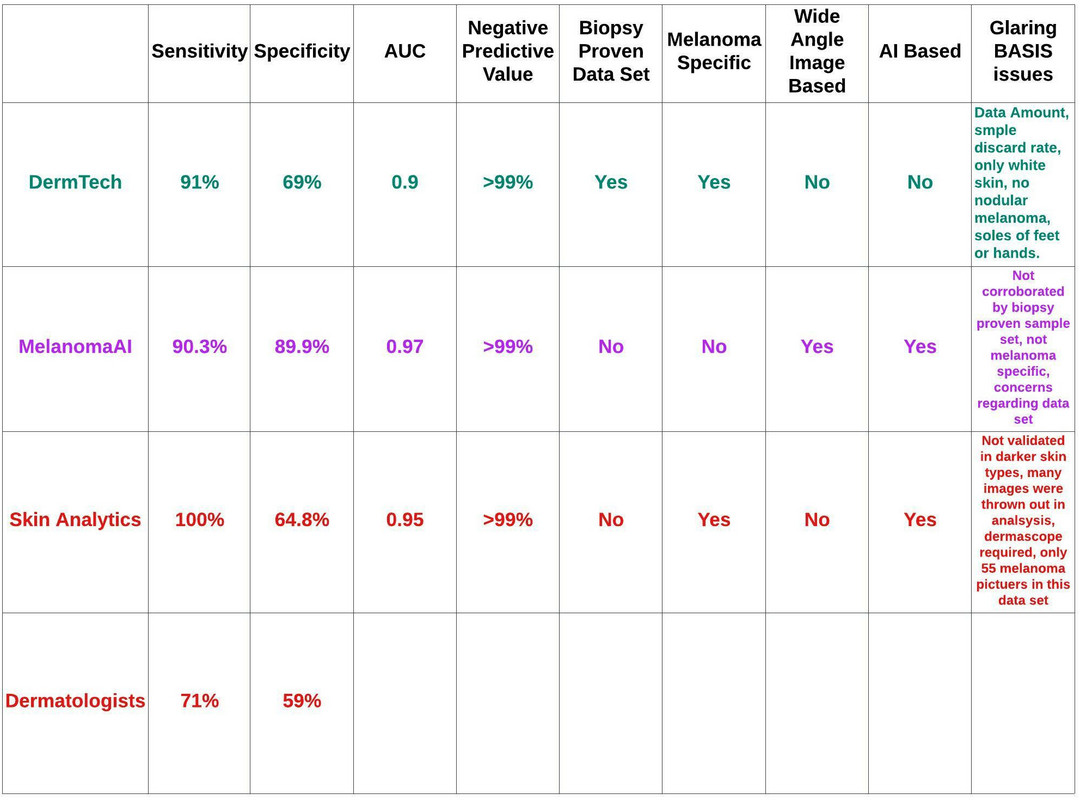
Figure 52: Comparative analysis of DermTech, Melanoma AI, Skin Analytics, and dermatologists.
The bottom line is there are no magic answers here. I can’t tell you to look for a specific sensitivity, specificity, AUC, etc. Obviously, the higher these numbers are the better. However, we can conclude that sensitivity is critically important as we must be able to identify patients who have melanoma, and cannot afford false negatives. All three companies offer high sensitivities. Skin Analytics is 100%, but they are sacrificing specificity to obtain this. Basically, they’re allowing for more unnecessary biopsies than their competitors in an effort to ensure no patients with melanoma are missed. Obviously, the 100% sensitivity is suspect and needs to be validated in real-world studies, which are currently ongoing by the UK NHS.
DermTech’s sticker requires that patients go to their dermatologist. It also requires physical application of a sticker the other companies do not. There is user variability intrinsic to this, and 14% of the samples in their seminal study were discarded due to this. The test is currently being assessed in real-world studies, with some data already available that supports their very high negative predictive value. Nonetheless, DermTech must be concerned about AI melanoma companies that can easily supplant them. Indeed, it might be worthwhile to sell their Smart Sticker directly to the consumer in retail stores or in the home. The issue is that the skin lesion needs to be clearly demarcated by the user, and it’s possible patients may not do this well.
Melanoma AI’s use of wide-angle pictures is very appealing as it would enable most anyone to quickly assess for SPLs with their camera. Presently, skin exams require a very methodical process that can be time consuming. To this end, the notion that a patient could have a picture of their skin taken at home or in the primary care office and be notified of overtly problematic SPLs is very intriguing. The issue is the data set used to validate the model wasn’t predicated on biopsy proven images. These studies are likely under way.
Skin Analytics has the advantage of substantial funding, and is already being used by the UK NHS. They have extensive real-world studies ongoing to validate their technology. The concern is that their AI requires images obtained via dermoscopy. Therefore, the intrinsically convenient nature of AI is being defeated by the fact patients still have to go to a dermatologist to use a dermoscope attached to a cell phone. Certainly, patients can be trained to do this, but getting every family in the UK a dermoscope seems infeasible.
Ultimately, if it were me in your shoes, I would make an investment in the melanoma detection space as there is an opportunity here based on the aforementioned harm and inherency arguments. The idea of being able to take wide angle pictures to identify SPLs in seconds in a patient’s home or primary care office is too attractive to pass on. Therefore, I would be inclined to invest in Melanoma AI, but I would tell them I need to see a study done on biopsy proven images before I fully commit. On that note, I would give Skin Analytics the ability to convince me they can use their AI without a dermoscope, and can also take wide angle pictures. If they demonstrate they can do this I would consider investing in their product, particularly with their UK NHS connection.
I would likely put some money into DermTech as dermatologists seem to be increasing their utilization of the Smart Sticker, and it’s extremely unlikely AI will completely supplant the Smart Sticker in the immediate future. Assuming I had a reasonable sum of money I would put 20% into DermTech, 40% into Melanoma AI, and 40% into Skin Analytics, contingent on each company addressing the aforementioned concerns, Melanoma AI finding a clinical partner, and Skin Analytics maintaining their UK NHS partnership.
Staying afloat
In full disclosure, I had no intention of writing this much for this entry in this editorial series. The rabbit hole was a lot deeper than I anticipated. However, this article was critical to setting the stage for the next 10 in this series where we will truly assess companies in the cell free DNA, genomics, clinical trial, drug development, and cellular therapy spaces. Indeed, the rubrics introduced here will be readily utilized in the next entry in this series focusing on cell free DNA in cancer screening.
The reader is reminded that the thought constructs here are not formally taught in business or data science programs. They have not been independently validated, nor do I have any intention of ensuring they are. The reader can do with them as they please. In addition, although meant to be a comprehensive review of confusion matrices in classification-based recommendation systems, this was not meant to be a review of AI. Important topics, such as underfitting and overfitting, were beyond the scope of this article.
The amount of collective human data is rapidly expanding. Knowing how to use data and assess those that do is imperative to future success. I firmly contend that everyone must develop some familiarity with data science, and you will find my favorite resource for this below. In medicine, fields that rely on direct visualization are particularly under fire by AI, including pathology, dermatology, and radiology. If I were in those professions, I would determine a way I could add value in an AI driven world, and be at the forefront of the overt trends we are seeing.
In this case we focused on early detection for melanoma, which is crucial. I presently care for several patients with stage 4 melanoma, one of which we are struggling to keep alive as his tumor is not BRAF V600E mutation positive, and he failed keytruda and dacarbazine. He is presently on opdualag, approved April 2022, as he refused clinical trial.
There likely isn’t a right answer regarding which of the melanoma detection companies you should invest in as CEO of BPTIG, and it’s important to know there are many other companies in this space I didn’t discuss here. Yet, I would be very interested in hearing what investment decision you made and why.
The final thought I will leave you with is that by using the aforementioned rubrics you can ensure that you, and others around you, use the statistical lamppost for illumination, rather than for support.
References
-
https://www.linkedin.com/pulse/human-knowledge-doubling-every-12-hours-amitabh-ray/
-
Dermtech.com
-
NCCN guidelines on melanoma at nccn.org
-
Ferris LK, Rigel DS, Siegel DM, Skelsey MK, Peck GL, Hren C, Gorman C, Frumento T, Jansen B, Yao Z, Rock J, Knezevich SR, Cockerell CJ. Impact on clinical practice of a non-invasive gene expression melanoma rule-out test: 12-month follow-up of negative test results and utility data from a large US registry study. Dermatol Online J. 2019 May 15;25[5]:13030/qt61w6h7mn. Erratum in: Dermatol Online J. 2019 Jun 06;25[6]: PMID: 31220892.
-
Google data
-
Soenksen LR, Kassis T, Conover ST, Marti-Fuster B, Birkenfeld JS, Tucker-Schwartz J, Naseem A, Stavert RR, Kim CC, Senna MM, Avilés-Izquierdo J, Collins JJ, Barzilay R, Gray ML. Using deep learning for dermatologist-level detection of suspicious pigmented skin lesions from wide-field images. Sci Transl Med. 2021 Feb 17;13[581]:eabb3652. doi: 10.1126/scitranslmed.abb3652. PMID: 33597262.
-
Phillips M, Marsden H, Jaffe W, et al. Assessment of Accuracy of an Artificial Intelligence Algorithm to Detect Melanoma in Images of Skin Lesions. JAMA Netw Open. 2019;2[10]:e1913436. doi:10.1001/jamanetworkopen.2019.13436
-
No reference
-
Srivastava R, John JJ, Reilly C, John AM, Rao BK. Sniffing out malignant melanoma: a case of canine olfactory detection. Cutis. 2019 Sep;104[3]:E4-E6. PMID: 31675402.
-
Willis CM, Britton LE, Swindells MA, et al. Invasive melanoma in vivo can be distinguished from basal cell carcinoma, benign naevi and healthy skin by canine olfaction: a proof‐of‐principle study of differential volatile organic compound emission. Br J Dermatol. 2016;175:1020-1029.
-
No reference
-
https://www.aad.org/dw/monthly/2021/december/feature-running-dry#:~:text=The%20United%20States%20could%20see,from%203%2C800%20to%2013%2C400%20physicians. AND https://cancerletter.com/capitol-hill/20220527_5/
-
https://www.alamy.com/the-gates-estate-on-lake-washington-in-medina-washington-image436597381.html
-
https://www.businessinsider.com/crazy-facts-about-bill-gates-house-2016-11
-
Ontario Health (Quality). Pigmented Lesion Assay for Suspected Melanoma Lesions: A Health Technology Assessment. Ont Health Technol Assess Ser. 2021;21[5]:1-81. Published 2021 Jun 4.
-
https://www.analyticsvidhya.com/blog/2020/04/confusion-matrix-machine-learning/
-
https://www.researchgate.net/figure/The-general-structure-of-a-ROC-curve-The-curve_fig1_309021263
-
https://medcitynews.com/2020/01/googles-ai-beats-humans-at-detecting-breast-cancer-sometimes/.
-
https://www.ajmc.com/view/ai-beats-radiologists-in-detecting-lung-cancer-study-finds
-
From Harry Potter and The Deathly Hallows, Part 1
-
American Cancer Society, Cancer Prevention & Early Detection Facts and Figures 2019–2020 (American Cancer Society, 2019).
-
American Cancer Society, Cancer Facts & Figures 2019 (American Cancer Society, 2019).
-
Ferris LK, Rigel DS, Siegel DM, Skelsey MK, Peck GL, Hren C, Gorman C, Frumento T, Jansen B, Yao Z, Rock J, Knezevich SR, Cockerell CJ. Impact on clinical practice of a non-invasive gene expression melanoma rule-out test: 12-month follow-up of negative test results and utility data from a large US registry study. Dermatol Online J. 2019 May 15;25[5]:13030/qt61w6h7mn. Erratum in: Dermatol Online J. 2019 Jun 06;25[6]: PMID: 31220892.
-
Soenksen LR, Kassis T, Conover ST, Marti-Fuster B, Birkenfeld JS, Tucker-Schwartz J, Naseem A, Stavert RR, Kim CC, Senna MM, Avilés-Izquierdo J, Collins JJ, Barzilay R, Gray ML. Using deep learning for dermatologist-level detection of suspicious pigmented skin lesions from wide-field images. Sci Transl Med. 2021 Feb 17;13[581]:eabb3652. doi: 10.1126/scitranslmed.abb3652. PMID: 33597262.
-
Phillips M, Marsden H, Jaffe W, et al. Assessment of Accuracy of an Artificial Intelligence Algorithm to Detect Melanoma in Images of Skin Lesions. JAMA Netw Open. 2019;2[10]:e1913436. doi:10.1001/jamanetworkopen.2019.13436
-
Willis CM, Britton LE, Swindells MA, et al. Invasive melanoma in vivo can be distinguished from basal cell carcinoma, benign naevi and healthy skin by canine olfaction: a proof‐of‐principle study of differential volatile organic compound emission. Br J Dermatol. 2016;175:1020-1029.
-
https://www.mskcc.org/news/five-surprising-facts-about-melanoma
-
Ferris LK, Rigel DS, Siegel DM, Skelsey MK, Peck GL, Hren C, Gorman C, Frumento T, Jansen B, Yao Z, Rock J, Knezevich SR, Cockerell CJ. Impact on clinical practice of a non-invasive gene expression melanoma rule-out test: 12-month follow-up of negative test results and utility data from a large US registry study. Dermatol Online J. 2019 May 15;25[5]:13030/qt61w6h7mn. Erratum in: Dermatol Online J. 2019 Jun 06;25[6]: PMID: 31220892.